AI Exposure Geography Is a Capacity Problem, Not a Red-Blue Problem

Working across research, policy, and data-driven analysis, the Editorial Board ensures that published pieces reflect a consistent institutional perspective grounded in quantitative reasoning and long-term structural assessment.
Authored On
Modified
AI exposure follows work and capacity, not party identity
The divide is between places that gain from AI and places that absorb its shocks
Policy should focus on tasks, infrastructure and local power, not red-blue maps

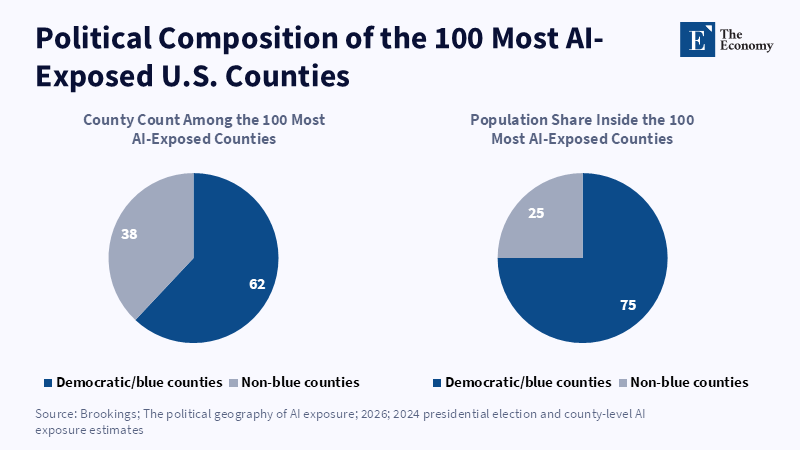
The clearest signal about generative AI is not found on party maps. Instead, it is on the work map. Out of the 100 most highly AI-exposed counties in the U.S., 62 supported Democrats in 2024 and these counties represent roughly three-fourths of the total population within that highly exposed cohort. At face value, that appears to be a neat political story. Yet it is not. Instead, it turns out to be a story about where office work, information-intensive companies, universities, high-speed internet, remote work and high-skill service jobs cluster. Consequently, AI exposure geography is not mainly a political map. It is a map of economic potential. Political danger is real, but it will not originate if one political party favors AI and the other does not. Instead, it will originate if some locations can leverage AI into increased productivity and others receive it as an external force that alters prices, employment, services and local power without giving those places much control over the gains.
AI Exposure Geography Starts With Work, Not Ideology
The fundamental error of the AI debate is to conflate "exposure" with "belief". A county can be characterized as "exposed" to AI simply because it has a lot of jobs that can benefit from AI, regardless of whether those jobs have a coherent attitude toward technology. New York, Seattle, San Francisco, Boston, Denver and Washington are AI-intensive not because of their voters' attitudes to technology, but because they concentrate high-value knowledge work. Those are the centers of software, finance, media, research, law, consulting, design, hospitals and government. That is where the text, the code, the data, the documents, the meetings and the repeated decisions have historically been crafted, as well as ultimately monitored and redesigned through software. Hence, the same county may be "blue" on a map of the vote, but "AI-exposed" on a map of its computer jobs. The correlation is real, but the cause lies in economic structure, not in party leanings.
This matters because policy follows diagnosis. If the geography of AI exposure is read as a political problem, the policy response will tend toward messaging, partisanship and symbolic regulation. If it is read as a structural problem, the policy response shifts. The relevant questions become more immediate: What job tasks can be automated? Which tasks are augmented? Which firms will have the capacity to redesign work processes? Which places will have sufficient digital infrastructure? Which workers will be displaced before they find the new tools? These are not red-blue questions. They are questions about task structure, firm power and local capacity and they raise a graver concern: that the places best equipped to leverage AI will be precisely those that need the least help.
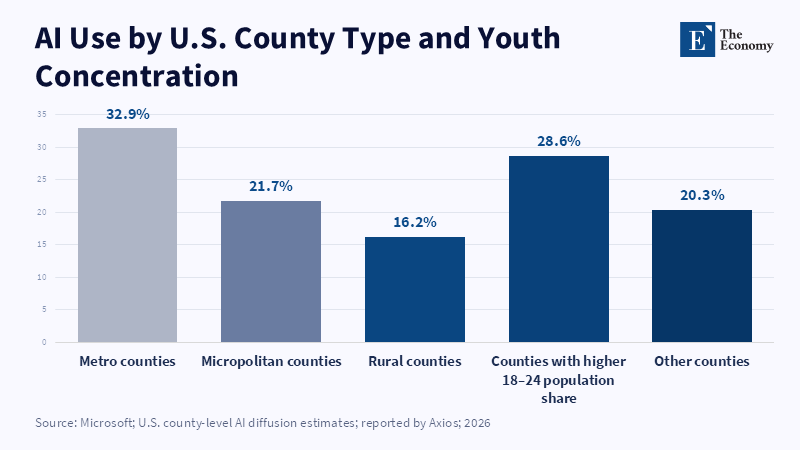
Global evidence points in the same direction. According to the International Labor Organization, about a quarter of workers around the world are in occupations with some exposure to generative AI. However, the level of exposure increases with income. In low-income countries, the exposed share is 11%. In high-income countries, it is 34%. This does not mean that high-income countries are more fragile in each and every respect; it means that they have comparatively more of the type of work that AI has access to today. The pattern is similar within the U.S. Microsoft data show average AI use at 32.9% in metropolitan counties compared to 16.2% in rural counties. It is not merely a matter of access to a chatbot; it's about the entire ecosystem around it.
Adoption Follows Capacity, Not Party Identity
The workplace data makes the point more starkly. Gallup has tracked that information workers in the U.S. using AI in their job at least a handful of times a year increased from 21% in 2023 to 40% in mid-2025 and then to 45% by the third quarter of 2025. The shift is rapid, though uneven. Use of the tool on a weekly basis is much more prevalent in tech, professional services and financial services companies compared to production or frontline operations. This is the essence of AI exposure geography. AI spreads first across job types that are already enclaved by digital information, where tools can be tested at low cost and outputs can be checked through email, code, briefs, slide decks, models or customer records. The tool simply tracks the workflow.
The same holds at the firm level. McKinsey's 2025 global survey revealed that 88 percent of organizations reported regular AI use in at least one business function, but only a third of them were further capitalizing on it across the enterprise. Surface adoption is simple. Deep adoption is complex. Deep adoption requires quality data, workflow redesign, training, governance, budget discipline and capable managers making decisions on what AI should support and what it must displace. Therefore, AI exposure as measured by logins is not the right indicator of where AI is. The true indicator is if use translates into durable productivity.
This undermines the notion that party identity catalyzes adoption. One 2026 NBER paper that examined the Gallup Workforce Panel found that democrats were more likely than Republicans to say they used artificial intelligence frequently at work, as a raw score, but also that the dichotomy was explained by education, occupation and industry. In blunt terms, democrats use artificial intelligence more frequently, not because party identity itself is a core explanation. Those public opinion numbers also challenge a factionalized reason for party adoption. In 2025, Pew found that 50 percent of republicans and 51 percent of democrats reported being more afraid than hopeful about AI and everyday existence. That is not the profile of one party embracing AI while the other rejects it.
However, the labor-market risk is more precise than a partisan story suggests. The World Bank's analysis of 285 million U.S. job advertisements shows that demand declined after ChatGPT for jobs with a higher AI substitution risk, even net of general exposure. Other research examining task-level AI exposure indicates that more exposed tasks reduce demand, while jobs with a higher variety of tasks better absorb a shock. This is the crucial nuance. AI doesn't affect "workers" evenly; it affects tasks, then job ladders, then regions. Entry-level administrative, routine professional and codified service workers tend to be most directly affected. More discretionary categories are only likely to harness AI to the extent that it enables them to operate more quickly and efficiently in pursuit of higher returns.
Remote Work Turns AI Exposure Geography Into Local Politics
Stated in economic terms, the political consequences of AI are more likely to flow from place than from party identification. Remote work has already altered the relationship between highly valued jobs and everyday commutes. Work-from-home was 24% of paid workdays among Americans aged 20-64 in 2025. Another study noted that from 2019 to 2024, the average round-trip distance from workers’ residences to their employers increased by over 70% and that 12 percent of workers hired after March 2020 lived at least 50 miles away from their employer. None of these is an insignificant lifestyle detail. It alters where people live, who pays city and local taxes, which neighborhoods compete for residents with high-valued jobs and which communities earn both income and newcomers but take none of the deep-pocketed firms that employ them.
This is where the geography of AI exposure becomes political in a more plausible fashion. Many of the workers most capable of leveraging generative AI are in roles that can support remote work. They might retain employment associated with a large metro even while living in a college town, a small city, or an affluent, amenity-rich suburb. That can be a boon for local economies; higher income flows support local retailers, restaurants, public institutions and local tax revenues. It can also boost rents, remake local politics and increase the separation between residents earning outside wages and residents relying on local labor markets; an AI-induced redistribution of employment does not need to be so extreme in order to be important.
The Real Divide Is Who Captures AI’s Gains
However, this process does not spare rural areas as such but brings them in from a different side. Not necessarily a codified peak of office work, but automation by the likes of logistics, farming, processing, customer care, administration of the health system and other public services. Meanwhile, many of these remote places lack the infrastructure that allows them to benefit from new digital instruments. Resource-constrained local clinics can only absorb AI if they have a workforce, broadband, purchasing systems and secure processes. Small-scale manufacturers can only benefit if they manage to connect AI to the wider sphere of the real economy. Counties can only be desirable if their broadband, transport, schools and accommodations are suitable for digital nomads. That is, access does not necessarily mean fulfilling conditions.
Hence, the strongest future divide could potentially run not only along urban-rural lines but also within rural economies. Some distinct but few micropolitan regions and college settings might get AI-adjacent winners. They will offer lower costs and sufficient digital and organizational capacity to pull workers and firms in those settings. Others may be washed away with worse service provision, a sparser aging workforce and total information pressure on most decisions from some faraway platform or domicile employer. Globally, this is also true. Human Development reports suggest AI could exacerbate disparities between nations because some economies will have the infrastructure, the skills base, or good governance to buffer from disruption, while many do not. This demonstrates that geographic inequality with respect to AI exposure is an all-encompassing capacity gap, at every scale.
A Capacity Policy for AI Exposure Geography
Policy should stop treating unemployment as the only risk. First, by abandoning "party" as the primary indicator of AI Risk. Election maps can show where exposed workers live, but they cannot explain why the exposure is happening or what can be done about it. A better public dashboard would start reporting task-specific exposure, AI adoption by industry, firm size, broadband quality, local training resources, remote-work flows, entry-level hires and wage pressures. It would work to disentangle three concepts that tend to get confused: technical exposure, actual adoption and appropriated value. A lawyer using AI-aided inspiration to draft faster, a call-center worker whose job has been largely automated, using a bot to complete calls and a barista whose order-taking persona has been digitized, using a chat partner to close a transaction are all manifestations of AI permeation. But they are not identical economic events.
The public policy also needs to defend the job ladder, not just the job numbers. Early AI disruption may not initially take the form of mass job losses. It may take the form of reduced entry-level jobs, less direct on-the-job training, a preponderant back office and increased individual penalties on workers to oversee tools they never built. That can impede mobility even if big employment numbers still exist. Policy can incentivize companies to clarify whether the AI deployment is designed to complement work, cut jobs, or redesign the entry level. Public agencies can track in real time how many entry-level job posts were published. Training demands may focus less on ambiguous general AI proficiency and more on contract conditions to task similarity: document review, customer support, coding, debugging, data verification, scheduling, procurement and compliance.
Regional policy that anchors AI as infrastructure plus leverage. Broadband can be a utility, however slow, so a focus on digital infrastructure still makes sense, but that isn't enough. Local areas need shared technical support, resources for public-sector purchasing, small-business advising, community benefits agreements for data centers and institutions that enable local firms to adopt AI without losing autonomy. Universities and community colleges can make a difference here, but only insofar as they serve as local capacity builders, rather than tourism ambassadors. The aim isn't to make every county the next Silicon Valley; it's to help places capture enough value from AI to defend their services, their firms and their workers from being entirely replaced by outside platforms.
That optimism has some basis. AI is going to be cheap, simple and handy enough that lagging places will be able to jump in. That one shouldn't deny. Cheap machines help local hospitals, small jurisdiction offices, exporters and rural clinics. But they do not help to get data, trust, security, training and management. The history of digital transformation shows that access often moves faster than actual benefit. Those places that win out most are, time and again, the ones that are able to combine access with coordination. This is the reason why it is not clear whether workers, firms, and regions can use AI on fair terms or not.
Thus, the start of the AI-exposed counties must be read cautiously. There may be many a post- Red and Blue AI-exposed county, but the figure is a warning against lazy causal claims and not a verification of it. AI exposure geography is not the beginning of a clean red-blue technology war. It is the next governance test: can policy recognize the pattern before anxiety hardens into backlash? The concrete policy task is to identify: ask where AI transforms tasks, diminishes ladders, strengthens already dominant regions and where local communities still lack bargaining power. The goal must be clear: turn AI into shared capacity, not another tool that lets dominant regions move faster while weaker places are told to adapt after the fact.
This article is based on an original research article published by The Economy Research. For the original version, please refer to Beyond Partisan Geography: Urban Economic Structure, Worker Exposure, and the Uneven Adoption of Generative AI.
The views expressed in this article are those of the author(s) and do not necessarily reflect the official position of The Economy or its affiliates.
References
Advisory Ranking (2026) ‘Operations & Transformation Advisory Industry Outlook 2026’, Advisory Ranking.
Advisory Ranking (2026) ‘Top 20 AI & Data Implementation Advisory 2026’, Advisory Ranking.
Akan, M., Barrero, J.M., Bloom, N., Bowen, T., Buckman, S.R., Davis, S.J. and Kim, H. (2025) ‘The New Geography of Labor Markets’, NBER Working Paper No. 33582. Cambridge, MA: National Bureau of Economic Research.
Anderson, M. and Bishop, W. (2025) ‘Republicans, Democrats now equally concerned about AI in daily life, but views on regulation differ’, Pew Research Center.
Bloom, N. and Makridis, C. (2026) ‘The Politics of AI’, NBER Working Paper No. 34813. Cambridge, MA: National Bureau of Economic Research.
Gmyrek, P., Berg, J., Kamiński, K., Konopczyński, F., Ładna, A., Nafradi, B., Rosłaniec, K. and Troszyński, M. (2025) Generative AI and Jobs: A Refined Global Index of Occupational Exposure. Geneva: International Labour Organization.
Hampole, M., Papanikolaou, D., Schmidt, L.D.W. and Seegmiller, B. (2025) ‘Artificial Intelligence and the Labor Market’, NBER Working Paper No. 33509. Cambridge, MA: National Bureau of Economic Research.
Healthcare Ranking (2026) ‘Top 20 Health Data Infrastructure & Interoperability Platforms 2026’, Healthcare Ranking.
HNW Ranking (2026) ‘Top 20 Family Office Technology Providers 2026’, HNW Ranking.
Kemp, A. (2025) ‘AI Use at Work Rises’, Gallup.
Liu, Y., Wang, H. and Yu, S. (2025) ‘Labor Demand in the Age of Generative AI: Early Evidence from U.S. Job Posting Data’, World Bank Policy Research Working Paper No. 11263. Washington, DC: World Bank.
McKinsey & Company (2025) ‘The State of AI in 2025: Agents, Innovation, and Transformation’, McKinsey & Company.
Misra, A., Wang, J., McCullers, S., White, K. and Lavista Ferres, J.M. (2026) Measuring AI Diffusion Across U.S. Geographies: County, State, and Metro Estimates. Redmond, WA: Microsoft Research.
Muro, M., Jones, T. and Methkupally, S. (2026) ‘The Political Geography of AI Exposure’, Brookings Institution.
Ranking News (2026) ‘National Competitiveness Indices and Their Role in Economic Policy Reform’, Ranking News.
Schellekens, P. (2025) The Next Great Divergence: Why AI May Widen Inequality Between Countries. New York: United Nations Development Programme.
Working across research, policy, and data-driven analysis, the Editorial Board ensures that published pieces reflect a consistent institutional perspective grounded in quantitative reasoning and long-term structural assessment.