Beyond Partisan Geography: Urban Economic Structure, Worker Exposure, and the Uneven Adoption of Generative AI
Published
The Economy Research Editorial*
*The Economy Research, 71 Lower Baggot Street, Dublin 2, Co. Dublin, D02 P593, Ireland
This paper clarifies the emerging politics of generative AI by showing how the geography of AI exposure is too easily conflated with partisan identity. Although AI-intensive U.S. counties tend to be more metropolitan and Democratic-leaning, this pattern does not reflect AI's political effects, but from the occupational, geographical and educational composition of exposed users. AI first diffuses through already digitized, remote-capable sectors and knowledge-intensive work embedded in data-rich organizational systems. The technology moves into rural and industrial regions through different channels, including automation, existing productive capacity, infrastructure constraints and insitutional resilience. This paper distinguishes between AI exposure, individual tool use and firm-level adoption. It explains why access to AI tools does not necessarily produce stable economic gains and identifies the channels most likely to have distinct political consequences, including residential sorting, uneven remote-work geography, worker displacement, and regional or international disparities among places able to use AI as augmentation and those that experience it as external disruption. The article argues for moving beyond partisan risk framing, toward structural indicators of task composition, workplace fragility, broadband access, local ownership capacity, and institutional resilience.
1. Introduction - Why AI Exposure Looks Political but Is Structurally Economic
Recent scholarship on the political geography of the emergence of artificial intelligence has usefully highlighted a real and socially significant empirical regularity: that the locations most likely to be exposed to the current waves of generative AI are inordinately metropolitan, professional and information-heavy.[1] However, that descriptive regularity has at times been too hastily taken to signify a political story (as if partisanship itself were an operative force in the phenomenon), when the more plausible and narrower interpretation is structural. AI is more rapidly spreading not because Democratic voters are more technophilic or Republican voters are more insulated, but because it is spreading where the occupational mix, organizational structure, information technology infrastructure and task architecture already make widespread adoption economically rational.[2] Brookings' own account is more measured than many secondary interpretations, in that it explicitly calls the pattern it observes an "underlying consequence of where people work and what skills they have," and not direct evidence that party identity itself determines AI-related behavior.[3] The flaw occurs when a properly qualified, context-dependent observation is extrapolated into a quasi-causal prediction of sustained partisan blowback.
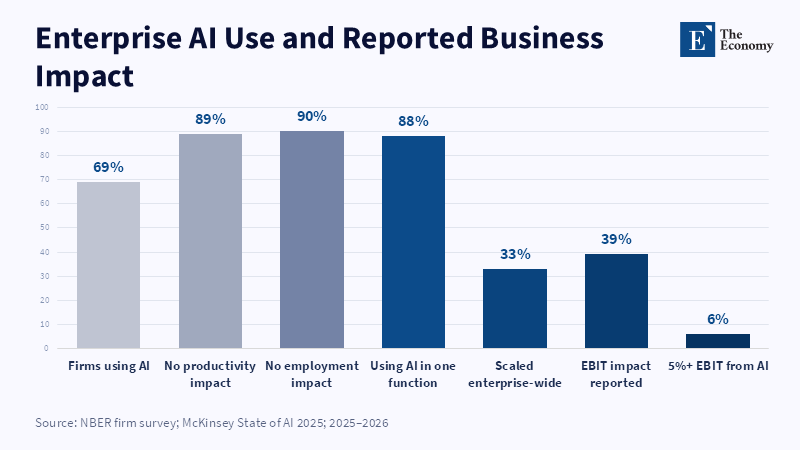
That distinction matters more in 2026 than it would have in 2023 because AI has passed the novelty stage and entered uneven but rapid rates of economic embedment. Gallup found that the share of U.S. workers using AI in their role at least a few times a year increased from 21% in 2023 to 40% by mid-2025, with adoption concentrated in white-collar industries: tech, professional services and finance.[4] As of late 2025, AI appeared on a daily basis in the workplace for 12% of U.S. workers, while nearly half of workers did not use AI at all in their current job, illustrating both rapid diffusion and persistent stratification.[5] At the firm level, NBER survey evidence from nearly 6,000 senior executives across advanced economies found that 69% of firms were actively using AI with younger, most productive firms adopting AI at higher rates[6] and McKinsey's global survey in 2025 found 88% of organizations are using AI in at least one business function, though only about a third of workers at those firms were using it across the enterprise.[7] Elsewhere, Microsoft's diffusion figures show 16.7 percent of the world has used AI in the past 6 months (end 2025) and 17.8 percent of the working-age population in the first quarter of 2026.[8]
In that context, misidentifying the origin of regional AI differentials need not be a trivial academic mistake. Policymakers reading blue-state AI as blue-state preferences will specify misguided policies. The actual channels are occupational sorting into high-skill, non-routine work; firm productivity incentives; the post-COVID separation of residence and workplace; and differential sectoral, regional, and countrywide gain shares. The central argument is simple: what currently looks like an AI red-blue divide is, in the end, a basically confounded overlay of urbanization, education and industrial composition. The politics that matter more will come not so much from party leaders' animosity to automation, but from second-order effects: the geographical relocation of remote-capable, high-income workers, the flow of pro-automation (augmentation benefits towards already high-income and well-placed metropolises and the spiraling gap between places that can use AI as augmentation and those that can only perceive it as externally imposed automation or exclusion.
2. Different Patterns of AI Displacement in Rural and Urban Economies
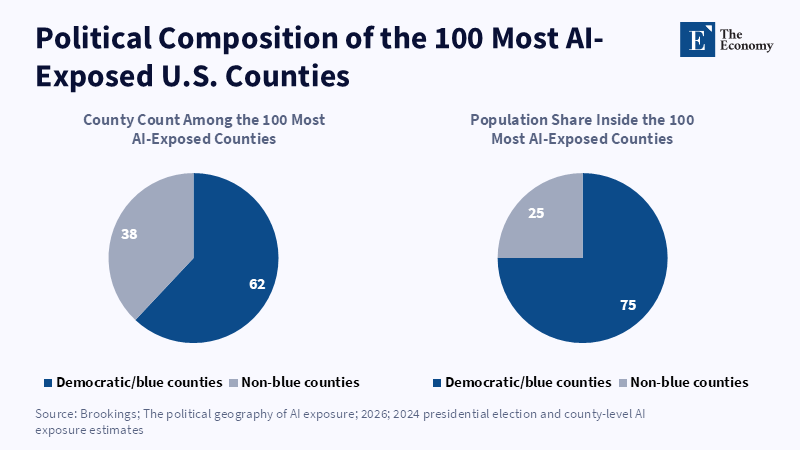
The starting point is not politics but economic geography. Brookings finds that 62 of the 100 U.S. counties most exposed to AI voted Democratic for president in 2024 and that in those counties between 14 and 19 percent of workers have jobs in which AI can both theoretically perform a task and is already being used in relatively automation-intensive ways.[9] But Brookings also makes clear why this distribution looks as it does: the exposure is centered in "high-level office or information-based work" such as programming, research, marketing and analysis, which is, in turn, located in large metropolitan areas.[10] The same occupational structure underpins both the AI score and much of the voting geography. And so, while the article's factual map is instructive, transforming it into a directly partisan mechanism is not.
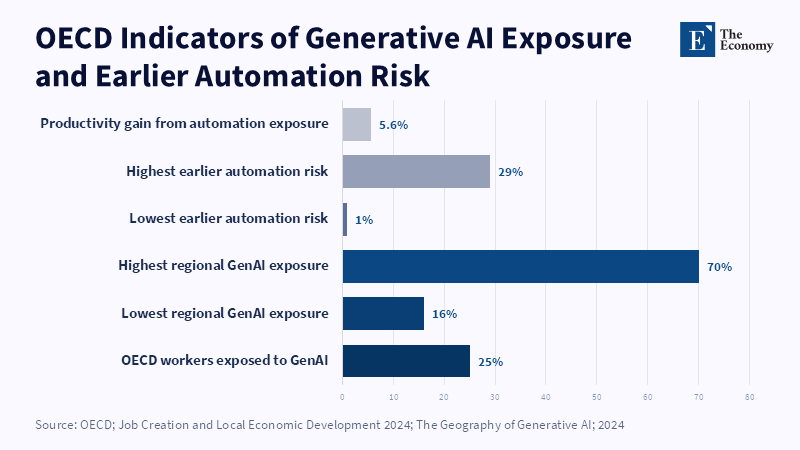
OECD evidence reinforces this argument with firmer comparative evidence. The OECD's 2024 report on the geography of generative AI calculates the share of workers in the OECD who are at risk of generative AI (in the sense that at least 20% of their job tasks could be accomplished 50% faster with the technology).[11] The estimated share is about one-quarter. Significantly, it confirms the fundamental change underway in the geography of technological risk. Earlier waves of robotization heavily impacted nonmetropolitan and manufacturing regions.[12] Generative AI is most at risk in metropolitan regions that, uniquely, are home to the nexus of education, ICT and finance[13] (the core of the knowledge economy). The regions least exposed to the previous robotization wave, in many cases, are also the regions most exposed to the present one. That is just why the map of AI looks so unlike that of robots of the 2010s.
The other side of the contrast, the U.S. rural economy, the U.S. rural economy, is organized around a different sectoral structure: USDA's Economic Research Service says that the typical rural workplace specializes in agriculture, forestry, mining, manufacturing, recreation and government, while the average rural area has a far smaller share of financial, professional, scientific and information-service activities[14] than the typical urban region. In 2025, roughly 25% of rural counties depended on manufacturing alone, 17% on agriculture and of 1,958 rural counties, there were 495 manufacturing-led counties and 329 farming-led counties.[15] These are not sectors with no technological change, but they are not sectors in which deploying large language models today is cheap, easy, or fast. The practical reason is straightforward: generative AI tends to scale first where the labor is highly digitized, text-rich, codified and calendared into existing huge data flows; large parts of technology, finance, professional services and administration fit that profile far better than farming, extractive industries or local service work.
That said, there is no reason to romanticize rural America as an AI refuge. The relevant distinction is not between exposed cities and pristine countryside, but between distinct technological trajectories. For many years, rural areas have been exposed to machinery, software, logistics, sensor networks, industrial automation and extraction technologies.[16] As OECD argues, previous automation already stripped many nonmetropolitan and manufacturing areas; rural manufacturing lost around 25% of jobs in the 2000s-"an enormous amount of job destruction"-and remained structurally exposed because much of it was footloose and exposed to competition.[17] The current wave of generative AI emphasizes cognitive work, but it will not erase the previous vulnerabilities of rural areas. Instead, it overlays a new, metropolitan way of exposing populations on top of existing risks of manufacturing and extraction industries. For this reason, classifying urban as vulnerable and rural as safe is almost as misleading as classifying blue regions as AI-friendly and red regions as AI-resilient.
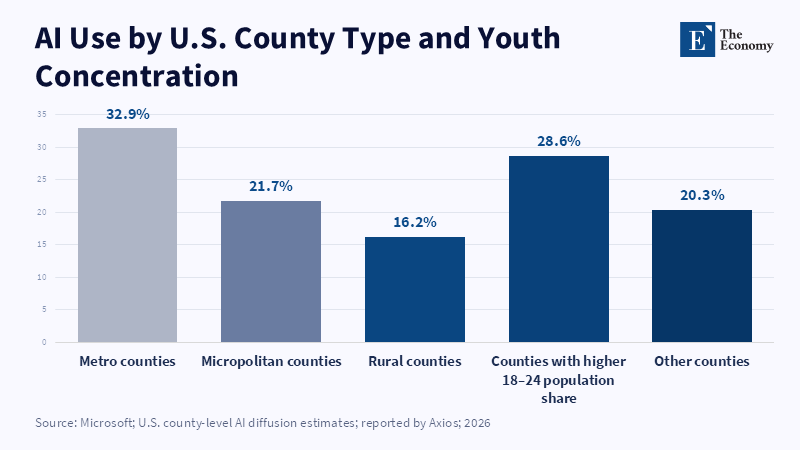
Microsoft's new U.S. county and metro diffusion estimates (28 May 2026) are further confirmation of the scale that the existing urban-rural gap has reached in action: artificial intelligence was used, on average, 32.9 percent in metro counties and only 16.2 percent in rural counties[18] and 21.7 percent in micropolitan counties; counties with higher proportions of their populations aged 18–24 years-particularly college towns-had significantly higher usage: 28.6 percent compared to 20.3 percent.[19] These are not employment measures: they are population-normalized values. However, they are indicators of the process: AI will first go where there are already colleges, digital skills and information-dense jobs that can benefit from being replaced or enhanced. A county does not become AI-intensive because it is politically blue; rather, many counties are both AI-intensive and politically blue because they are metropolitan, highly educated and concentrated in sectors currently easiest to augment or automate.
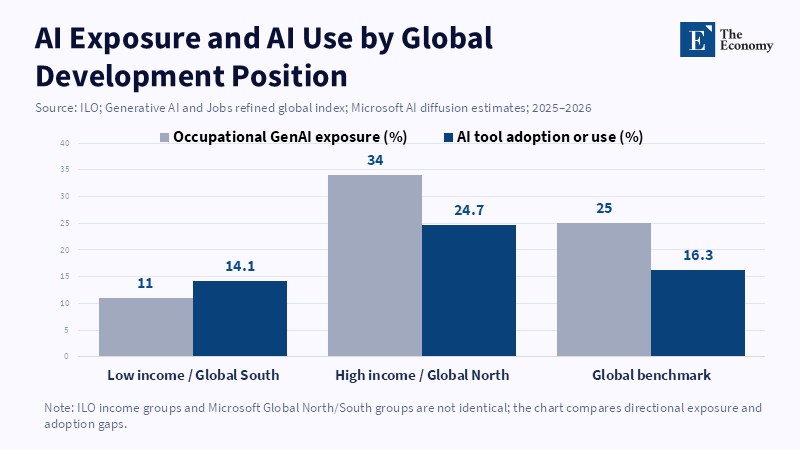
This same structure holds true elsewhere in the world. The International Labor Organization's comprehensive global exposure index found that one out of four workers worldwide is in a job with some exposure to generative AI,[20] but total exposure jumps significantly with a country's income, from 11% of employment in low-income countries to 34% in high-income countries.[21] Microsoft's global adoption data reveal a similar pattern: by the second half of 2025, 24.7% of the economically active population in the Global North had used AI tools, versus 14.1% in the Global South.[22] (And the adoption rate in the north doubled over that period, while the south's growth was only one-half that.) The United Nations Development Programme (UNDP) "Next Great Divergence" report goes even further: in several economies, in high-income countries, nearly two-thirds of the population already uses AI tools, in contrast to many low-income countries, where adoption hovers around 5%.[23] Clearly, for the rural-urban divide within countries and the industrial-agricultural divide between countries, there is only one story, with variations: they are just two different axes of the same phenomenon: generative AI first comes to countries with a concentration of information-intensive work, human skills, access to investment in hardware or connectivity and institutional capacity.
3. Does AI Adoption Have Anything to Do With Political Stance? No
At the individual level, the most recent evidence is strongest and most straightforward against the hypothesis that party identity is the true causal driver of workplace AI adoption. Bloom and Makridis (2026) use Gallup Workforce Panel data in an NBER paper that finds a raw partisan difference in reported AI use, with Democrats using AI more than Republicans, but this difference ceases to be statistically significant once controlling for education and reverses in sign in occupation and industry fixed effects saturated specifications.[24] They are clear in their conclusion that, though it appears that there is a partisan gap in self-reported AI use, this gap is largely an artifact of educational and occupational sorting.[25] This is precisely the kind of result expected if the party difference in AI adoption is driven by correlations between party identity and occupation, while party affiliation driving the choice of workplace is not the driving factor of individual AI adoption within a workplace.
Interestingly, Brookings does not actually refute this. The article cautions that the political implications of its map will be an "implied consequence" of "where people work and what skills they have" and "the link between county AI exposure and Democratic vote share is a correlation "without a causal mechanism." This caveat is pivotal, not incidental. The misinterpretation begins when a later commentary treats the county-level correlation as if the causality has already held up after controlling for urbanicity, education levels, industrial configuration and digital infrastructure. Linguistically and rhetorically, calling the correlation spurious is powerful, if inaccurate. The true assessment is omitted-variable bias plus causal overinterpretation. The political variable bears the burden of the deeper structural-socioeconomic variables with which it is known to have been historically correlated.
This is made even more transparent when the underlying American political geography is considered. Pew finds that urban counties have been reliably Democratic (60%-37%, Dem-leaning, Rep-leaning voting districts, respectively). Rural counties have been the opposite, with a twenty-five-point GOP advantage.[26] Moreover, these trends pre-dated the emergence of generative AI by decades. When Microsoft estimates the correlation between urbanization and AI use is roughly two to one, the problem of the omitted variable is even more plain. A simple county-level regression that regresses Democratic vote share on AI exposure effectively controls for a political trend and an economic trend simultaneously: it is a measure of overlap, just not of causality.
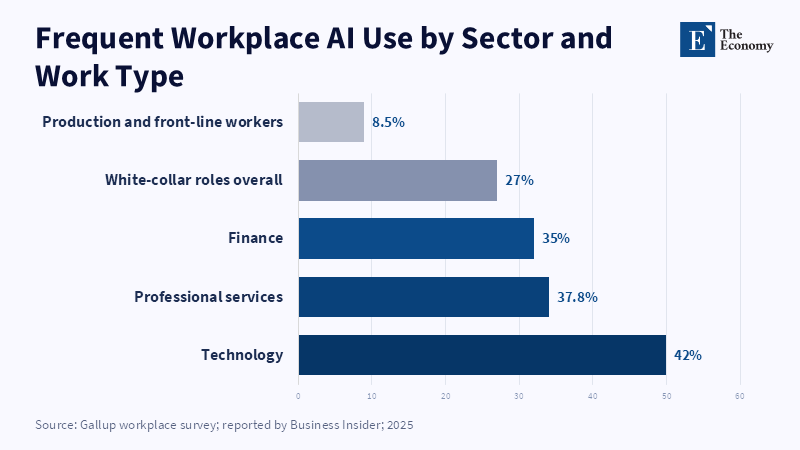
Firm behavior is in the same direction. Adoption happens when it can raise productivity, shorten turnaround time, standardize outputs, or substitute for hard-to-get input. Evidence from NBER firm surveys finds that 69% of firms are actively experimenting with using AI and though it is used more in more productive, newer firms, still 69% is significant. McKinsey's global survey reports that 88 percent of all organizations are using AI in at least one function, but most still are at the experiment or trial stage and only 39 percent report EBIT impact at the enterprise level. Gallup's workplace dataset for 2025,21 shows that the highest frequent-use rates are in technology, professional services and financial services, but production and front-line work remain unchanged. None of these gradients is inherently partisan. Rather, they are gradients of task codifiability, data availability, managerial capital and anticipated value. Firms buy software because it will tend to produce better margins or throughput, not because a county voted one way rather than another.
Public opinion evidence weakens the partisan-adoption hypothesis further. Pew found in late 2025 that Republicans and Democrats had become nearly equally likely to say that they were more concerned than excited about AI in daily life-50% of Republicans and 51% of Democrats-despite their continued disagreement over who should regulate it.[27] Annenberg's 2026 nationally representative survey offered similar results across the board, with broad pessimism and the sense that the government has done far too little to regulate AI-77% of Democrats, 72% of independents and 53% of Republicans.[28] That is not the set of opinion profiles one expects if one party is pushing AI and the other is fighting it. That is the set of opinion profiles we see in a public that is concerned and uncertain, simply divided along different questions of which institution to trust.
This does not mean that politics is not relevant. Instead, it means that politics is delayed and more mediated in effect than simple adoption maps suggest. Bloom and Makridis find that by early 2026, a 4.2 percentage point partisan gap had developed in beliefs about displacement risk, even as the behavioral adoption gap itself disappears under controls.[29] That matters. It indicates that judgments about AI risk may begin to diverge before real behavioral adoption does. But even in this case, the causal connection still flows through structure. People infer risk from their position in the labor market, from media framing, from observable changes in workplace tasks, and other workplace signals. Partisanship may influence how they interpret those signals, but it does not generate the exposure itself.
Recent labor-market evidence also complicates any straightforward story in which AI exposure directly induces leftward anti-AI sentiment. World Bank authors using 285 million U.S. job ads reveal that ads for occupations with high substitution were relatively lower after ChatGPT, with higher increases for jobs in the lower rungs of administrative and professional service jobs.[30] Hampole et al. show that high-AI-exposure tasks saw smaller (i.e., less-negative) post-expansion labor demand, but the demand losses were less significant when activity was dispersed across multiple tasks, allowing for effort redistribution.[31] A third 2025 Working Paper by Antoniades, Balcazar, Chatzikonstantinou and Kern, however, demonstrates how local AI adoption may boost Democratic vote share through a combination of local economic improvements and in-migration of more skilled workers.[32] In other words, political effects are heterogeneous and mediated. The very same technology causes demand to decline in some clusters of tasks while enhancing local growth through other clusters of jobs. Indeed, party affiliation is an overly broad control to use for causal identification.
This does not mean that politics disappears; it means that the causal analysis should be shifted away from party identity. Politicians may set the guardrails, the competition policy, the labor standards, the data-centers permitting and the public investments. Voters may reward or punish visible results. But the broad diffusion of AI in 2023-2026 has been in large part driven by sectoral and occupational economics. Regardless of which party wins the elections, firms located in exposed sectors will keep looking at the shape of the trend on the application side because competitive pressure operates through transpartisan incentives. Policy can affect speed, direction and dimension; it is far less effective at shifting incentives to deploy the technology in the field where it is economically transparent.
4. Political Division May Be Driven Less by AI Productivity Pressure Than by Lifestyle Change
If direct partisan causes appear weak, the more credible basis for political effect lies in the reshuffling of residence, commuting and local membership. The pandemic had already weakened the old assumption of high-value work having to take place near the employer's office. As late as 2025, the NBER estimates placed work from home at roughly 20 to 40 percent of paid workdays of Americans aged 20 to 64.[33] This is not a marginal political epiphenomenon. It is a resilient restructuring of the place where economically valuable labor can happen. Because many of the jobs most suited to work from home are also among the jobs most exposed to present AI, the overlap between AI exposure and lifestyle geography is not accidental. It is engineered into the same cluster of jobs.
The labor market's geography is already evolving. According to NBER's "The New Geography of Labor Markets," between 2019 and 2024, the daily average commute length from home to the work-site of the employer increased by more than 70%,[34] and by 2024, 12% of all post-March 2020 hires lived fifty or more miles from their job site, three times the pre-pandemic share.[35] The gain was the biggest for high hourly wages and for finance, information and professional services, the sector where workplace AI use is likely to be at its most intensive. For workers with ample resources and jobs that can be done remotely, the opportunities for net migration to lower-cost and tax jurisdictions where offline work can be done from that location using screens will likely intensify over time.
That point requires elaboration. AI does not eliminate the gains from agglomeration. Cities still contain deep labor markets, venture capital ecosystems, university research hubs, local customers and dense social capital among professionals. The data also does not point toward a simple story of mass exodus into the countryside; instead, the evidence points to selective residential decoupling. Certain sections of the AI-intensive workforce have the ability to embody their workplace preferences in where they live, in terms of housing affordability, local amenities, family constraints, or tax preferences, rather than the need to commute in from the city every day. The political implications thus hinge less on a rapid discontinuity in employment and much more on a gradual reorganization of population, polling location and gentrifying elites, who move selectively into towns and smaller cities without necessarily bringing with them the knowledge-intensive firms in which they work.
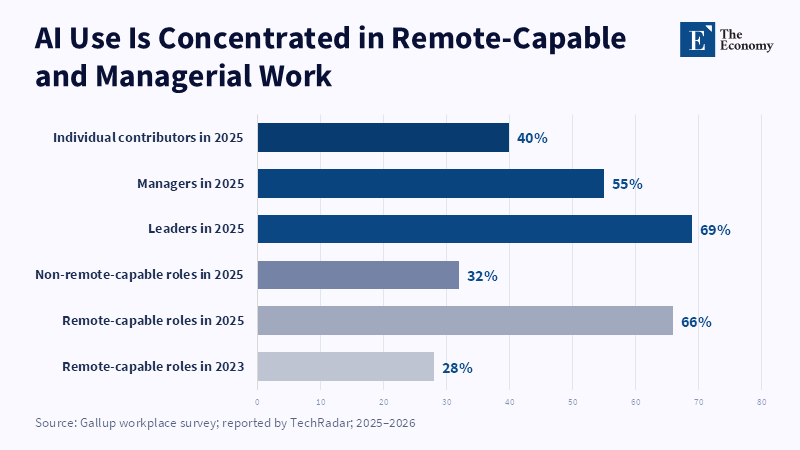
This helps to explain why not all of the political conflict in the aftermath might fall along "worker versus machine" categories. It turns out remote work itself already displays ties to county-level political traits. Cowan and Garcia show that, holding the 2016 share of the vote Democratic constant, a standard deviation increase in the Democratic vote share results in a 1-2 point rise in probabilities of working remotely and an additional 2 points in the share of job postings calling for remote work.[36] They take this to be an indication of the characteristics of work arrangements that locals desire once the pandemic makes those desires feasible. If AI further boosts the payoffs of occupations that are more capable of supporting remote work, then its partisanship impacts are likely to follow those trends rather than define them. The technology will intensify existing settlement and workplace-preference patterns rather than create them from scratch.
Simultaneously, however, not every remaining rural location is equally well positioned to take advantage of that reorganization. Broadband system conditions are the determining factor. The USDA points out that high-speed internet is absolutely critical to participation in the online economy and according to the source summary that the USDA surfaced, the United States still has around 24 million people without high-speed broadband connectivity.[37] According to Microsoft's data on subnational diffusion, in the short-to-medium term, the cluster of optimistic cases seems not to be rural America generally, but particular connected places: micropolitan counties, college and university towns, amenity-rich ones able to turn digital throughput into true economic engagement. Already, those with a more robust presence of universities experienced dramatically higher levels of AI penetration; therefore, a selective geography of densification is taking hold even inside the rural category itself.
This is where the savvy of local and state policymakers, institutions and communities will be tested: small connected places and rural-adjacent counties may heat up, for example, by drawing well-compensated remote workers from elsewhere, thus raising the cost of living and changing consumer demands, tax burdens and political coalitions. The less connected, however, could well find themselves losing younger workers while services like telehealth, digital administration and retail move to the cloud sans any remedial local labor demand. The Siegel Family Endowment's 2026 rural consultation makes this clear: the question is not whether digital technology will shape rural geographies, but whether it will do so with or without any meaningful local ownership.[38] For rural places, at least for now, this gets to an essential question: do the infrastructure, ownership structures and bargaining power exist for local communities to retain a meaningful share of the productivity gains?
Viewed in this light, politicized AI can be a matter of neighborhood fortunes rather than party ideologies. The technology can serve to intensify an already ongoing spatial sorting dynamic. Some places will attract residents, income and internet access. Others will attract only the downstream consequences, such as the concentration of services, conflicts over zoning, or decisions by distant companies. Any backlash that emerges will resemble less classic anti-automation antagonism than older conflicts over belonging, infrastructure, housing and fiscal fairness. That would be a different politics than the simpler formulation of the Brookings project and one that may be more durable.
5. AI May Deepen Inequality Between Productivity-Boosted Urban Regions and Pre-AI Rural Regions
The biggest medium-term danger, then, is not polarization of multi-region attitudes to AI-liberals on the coasts oppose AI, conservatives in the heartland support it. It is the polarization of productivity among contexts that machine intelligence will further stratify already more productive places from the rest. This is the common thread running through the early adoption literature. The NBER work demonstrates that firms are already deploying AI more often when they are more productive and younger. Gallup finds the earliest use happens in the tech sector, in finance, in professional/managerial jobs and in jobs with the opportunity to work remotely. Microsoft's county data show that AI usage is already far higher in metropolitan areas than in rural ones. The thread uniting these findings is that AI is already being adopted where organizations are already strongest-organizational capacity, human capital and digital infrastructure. In regional-development terms, that is a formula for cumulative advantage.
Anthropic's 2025 Economic Index strengthens the inequality argument at a granular level.[39] It observes that AI is geographically clustered, both globally and within the United States and is associated with higher income levels in cross-sectional country data. But when it looks inside the U.S., the pattern becomes more revealing. The adoption of general-purpose AI varies by local industry composition and concludes that advanced adopters are more heterogeneous in their uses and their facilitation effects, while less advanced adopters are more often adopting simple one-way, fully automated task-specific applications even after the task structure is accounted for. The implication is clear: early movers are employing AI in richer environments and in richer, more iterative ways and building up tangibly related skills. Weak adopters risk acquiring narrower and simpler approaches to AI[40] from the bottom up, one step at a time."
Labor-market evidence is increasingly consistent with this asymmetry. The World Bank job-postings study shows that demand for high AI-susceptible occupations declined relative to low-susceptibility occupations following ChatGPT's advent and that this effect grew stronger over time and was especially large for entry-level, administrative support and service-provision positions. Hampole and coauthors likewise show that a higher average onset-AI exposure at the task level reduces labor demand, but that this effect is somewhat mitigated when exposing workers to a narrowly constructed set of tasks that allows reallocating effort into adjacent duties. This is exactly how distributional outcomes become so asymmetric. Highly complementary positions-managerial discretion, client interaction, application expertise, or problem-solving authority -- are able to realize gains in productivity. Low-complementary, codification-essential positions are less able and suffer from weaker outside options and more dramatic compression.
This distribution pattern is sure to exist in other dimensions, between places as well as between occupations. OECD points out that the COVID post-recovery has been associated with faster and larger additions in metro areas and its generative AI report forewarns that the new wave of exposure is still operating in those same metros. And Microsoft's U.S. numbers boil down the existing productivity gap to a 16.7 percentage points differential between metro and rural counties. On the global scale, Microsoft estimates the Global North's late 2025 adoption level at 24.7 percent compared to 14.1 percent in the Global South, while the UN Development Programme cites the starting point for uneven levels of connectivity, skills, compute and regulation into a looming "Next Great Divergence" among countries. The same underlying logic is visible across scales: the places best equipped to turn AI into productivity gains are also the places most likely to compound their advantage.
This is precisely where ordinary techno-optimist counterarguments deserve to be taken seriously. It is certainly the case that AI has the capacity to boost productivity and address labor shortages. The OECD has shown that in the previous wave of automation, a 10% increase in jobs at high risk of automation was correlated with a 5.6% rise in labor productivity over five years, even though some regions experienced job losses.[41] It is also true that some businesses experience efficiency and financial gains from AI implementation and that economic entities can employ AI to mitigate pressures from rising labor costs. However, none of these factors can redeem the analogy that AI is simply a calculator or search engine, because generative AI delves into language-centric, irregular, intellectual tasks that were once considered somewhat resistant to such changes. Generative AI is not merely an additional instrument in office work; it changes the boundary between assistance, substitution and task redesign.
The democratization argument can also be nuanced. Cheap access to a chatbot does not equal widespread participation in the AI economy. Microsoft demonstrates that almost four billion people lack the essentials for the AI economy; Anthropic exemplifies the enduring centrality of wealthier economies to usage; the ILO illustrates that exposure grows rapidly alongside national income; the UNDP warns that countries without advanced digital infrastructure face challenges of both adoption and vulnerability. The real political economy question is therefore not just whether AI is superficially accessible but who ends up with the enabling assets around it: compute, proprietary data, managerial expertise, legal understanding, platform access and organizational capacity to re-engineer workflows. User-facing access does not automatically translate into democratic capture of economic value.[42]
The policy implication is immediate. The policy implication is to stop using party identity as a proxy for AI vulnerability or AI receptiveness. Occupation mix, remote-work capacity, commuting basin, firm productivity, broadband density and local capture of the gains, respectively, will be the relevant indicators. That indicates a different policy architecture. County-metro-micropolitan regional employment monitoring should be based on adoption, task exposure, commuting, hiring, not election data. Adjustment policy should be aimed at task-amenable entry and administrative positions, especially in professional service urban labor markets with existing displacement, while rural policy should focus on infrastructure, bargaining power (broadband, local compute access), community benefit agreements around AI-dedicated infrastructure and locally based enterprise support so rural areas do not become low-cost sites of extraction while value is created everywhere else. Organizational governance should differentiate between augmenting and automating each deployment, requiring firms and government to be explicit about their logic of job and work redesign, instead of concealing structural change behind politicized talk about productivity.
6. Conclusion - From Partisan Maps to Structural AI Policy
The fundamental flaw of the red-blue lens for understanding AI exposure is not that the geography is wrong. It is that the causal story is too thin. Metropolitan, educated, information-intensive parts of the country really are more exposed to generative AI; many of those places vote Democratic, but the similarity is mainly driven by urbanity, job type, presence of universities, digital infrastructure and corporate incentives, not by partisanship. In fact, the available evidence points in the same direction: accounting for education, occupation and industry and there is little basis for claiming that the partisan work-use divide exists at all.
The more significant political implications of AI are coming through these second-order pathways. AI-intensive, remote-capable work is shifting residence and local labor market populations. Advantageous firms and metropolitan areas will be more successful in capturing the parallel gains. Disadvantaged areas and lower-capacity regions will face worse terms of engagement: more distant, more dispersed and under weaker local terms of ownership. The real crisis does not lie in a streamlined partisan backlash centered in Blue America. It lies in a diverging hierarchy where the ones best equipped to utilize AI as augmentation do so without sidelining other places and the ones least equipped to do so find themselves continually replaced, automated and shaped by outside influences. Policy should be reoriented from partisan lenses to structural alternatives: develop tools to measure when and where exposure is hardest (task composition and regional attributes), secure transition points in the labor market and invest in capacity, governance and policy, so that lagging places gain instead of suffer.
References
[1, 2, 3, 9, 10] Muro, M., Jones, T. and Methkupally, S. (2026) ‘The political geography of AI exposure’, Brookings Institution.
[4, 5] Gallup (2025) ‘How Americans are using AI at work’, Gallup Workplace Survey.
[6] Bick, A., Blandin, A., Eberly, J.C., Patnaik, S. and Steinsson, J. (2026) ‘Why is the U.S. outpacing European countries in AI adoption?’, Brookings Institution / National Bureau of Economic Research.
[7] McKinsey & Company (2025) ‘The State of AI in 2025: Agents, Innovation, and Transformation’, McKinsey & Company.
[8, 18, 19, 22, 42] Microsoft AI Economy Institute (2026) ‘Measuring AI diffusion: Global and subnational estimates of AI use’, Microsoft.
[11, 12, 13, 16, 17, 41] OECD (2024) Job Creation and Local Economic Development 2024: The Geography of Generative AI. Paris: OECD Publishing.
[14, 15, 37] USDA Economic Research Service (2025) ‘County typology codes and rural economic structure’, U.S. Department of Agriculture.
[20, 21] International Labour Organization (2025) Generative AI and Jobs: A Refined Global Index of Occupational Exposure. Geneva: ILO.
[23, 42] United Nations Development Programme (2025) The Next Great Divergence: Why AI May Widen Inequality Between Countries. New York: UNDP.
[24, 25, 29] Bloom, N. and Makridis, C. (2026) ‘The politics of AI’, National Bureau of Economic Research Working Paper.
[26] Pew Research Center (2024) ‘Partisanship in rural, suburban and urban communities’, Pew Research Center.
[27] Pew Research Center (2025) ‘Republicans and Democrats are nearly equally concerned about AI in daily life’, Pew Research Center.
[28] Annenberg Public Policy Center (2026) ‘Many Americans are pessimistic about AI’s impact and want more regulation’, University of Pennsylvania.
[30] Liu, Y., Wang, H. and Yu, S. (2025) ‘Labor demand in the age of generative AI: Early evidence from U.S. job posting data’, World Bank Policy Research Working Paper.
[31] Hampole, M., Papanikolaou, D., Schmidt, L.D.W. and Seegmiller, B. (2025) ‘Artificial intelligence and the labor market’, National Bureau of Economic Research Working Paper.
[32] Antoniades, A., Balcazar, C.F., Chatzikonstantinou, E. and Kern, A. (2025) ‘Artificial intelligence adoption and local political change’, Working Paper.
[33] Barrero, J.M., Bloom, N. and Davis, S.J. (2025) ‘The evolution of work from home’, National Bureau of Economic Research / WFH Research.
[34, 35] Akan, M., Barrero, J.M., Bloom, N., Bowen, T., Buckman, S.R., Davis, S.J. and Kim, H. (2025) ‘The new geography of labor markets’, National Bureau of Economic Research Working Paper.
[36] Cowan, B.W. and Garcia, K.S.D. (2024) ‘Remote work and political preferences: Evidence from U.S. counties’, National Bureau of Economic Research Working Paper.
[38] Siegel Family Endowment (2026) Shaping AI on Rural Terms: Infrastructure, Ownership, and the Question of Who Captures the Gains. New York: Siegel Family Endowment.
[39, 40, 42] Anthropic (2025) Anthropic Economic Index: Geography, Adoption and AI Use. Anthropic.