
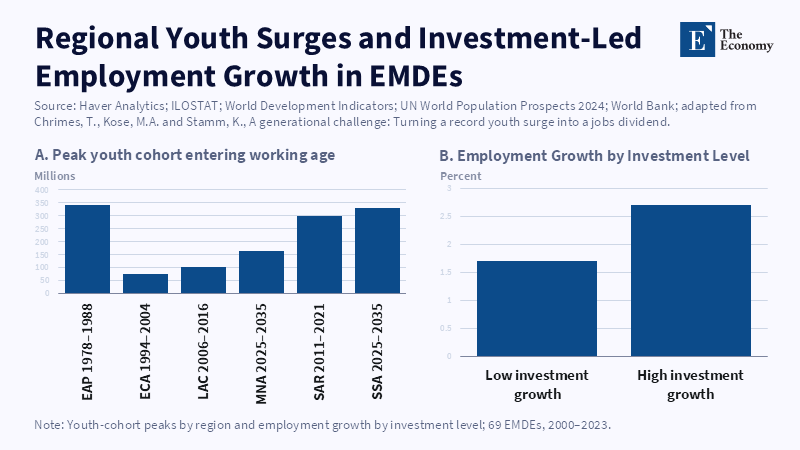
Figure 1: Large youth cohorts become a dividend only when investment turns labour supply into employment growth. Related article: The New Labour Barga
Read More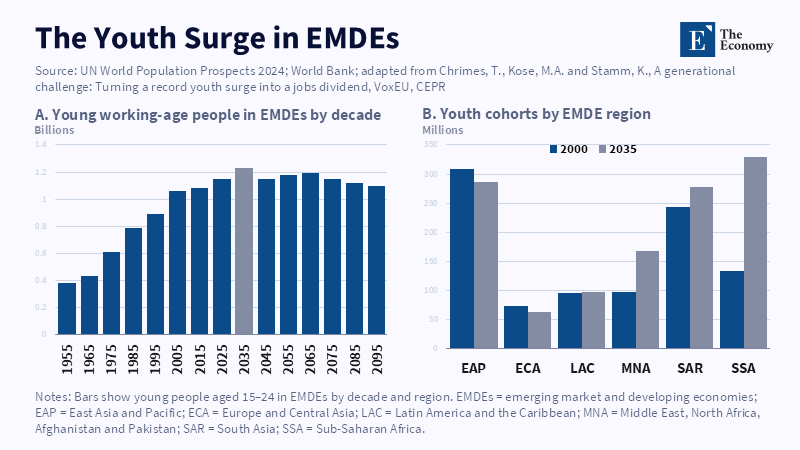
Figure 1: The youth surge is shifting toward South Asia and Sub-Saharan Africa, making EMDE job creation a global labour-market issue. Related article:
Read More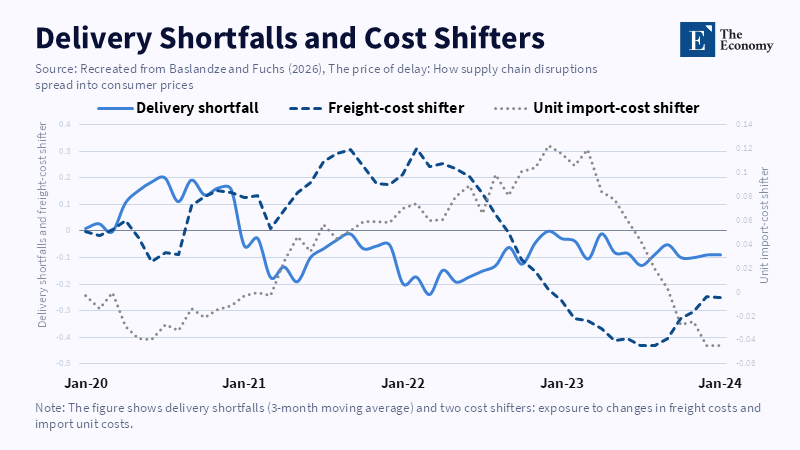
Figure 2: Delivery shortfalls moved with freight and import-cost pressures, showing how scarcity and costs reinforced each other. Related article: Su
Read More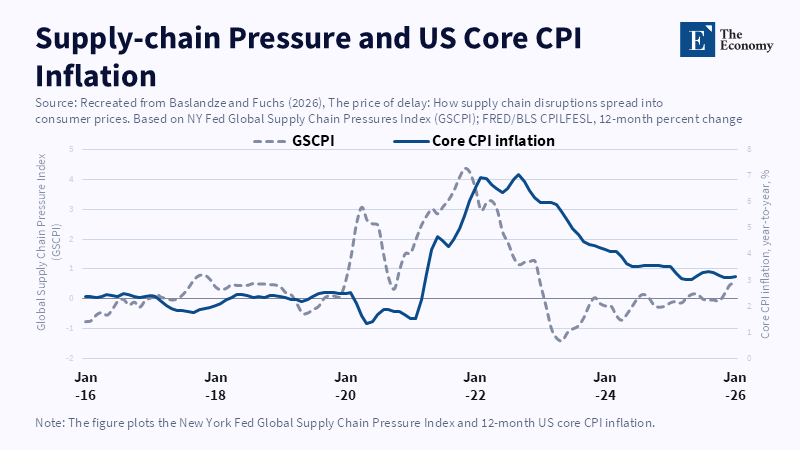
Figure 1: Supply-chain pressure surged before core inflation peaked, showing why logistics shocks can become delayed price pressure. Related article: Su
Read More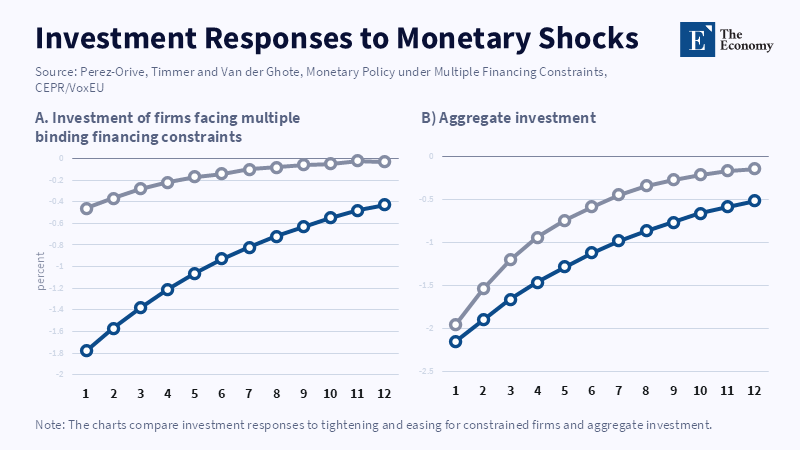
Figure 2: The model shows tightening causes a deeper investment fall than equal easing can reverse. Related articles: Asymmetric Monetary Policy an
Read More


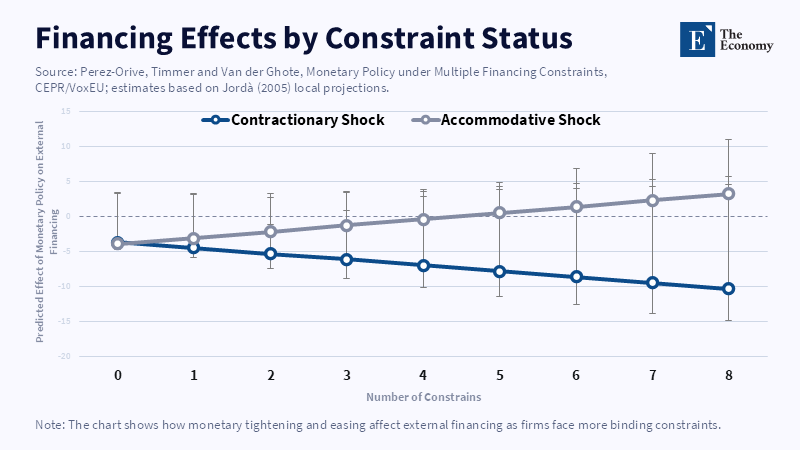
Figure 1: Tightening cuts external financing more sharply as firms face more binding constraints. Related article: Asymmetric Monetary Policy and th
Read More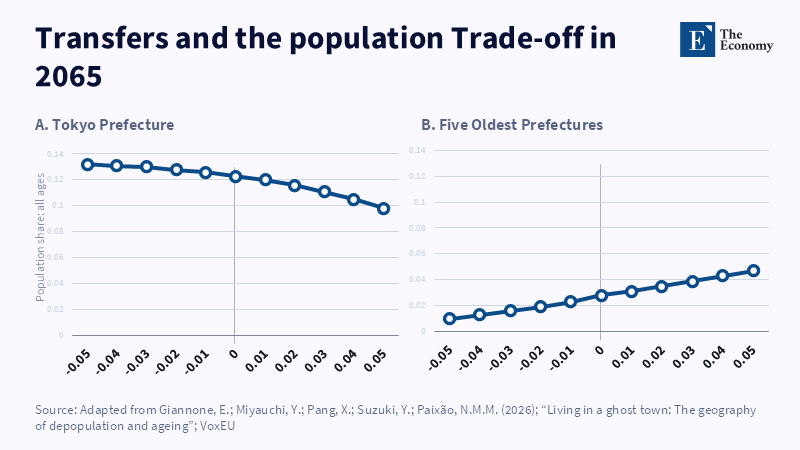
Figure 2: Transfers can slow decline in the oldest prefectures, but the gain comes with a visible reduction in Tokyo’s population share. Related Article:
Read More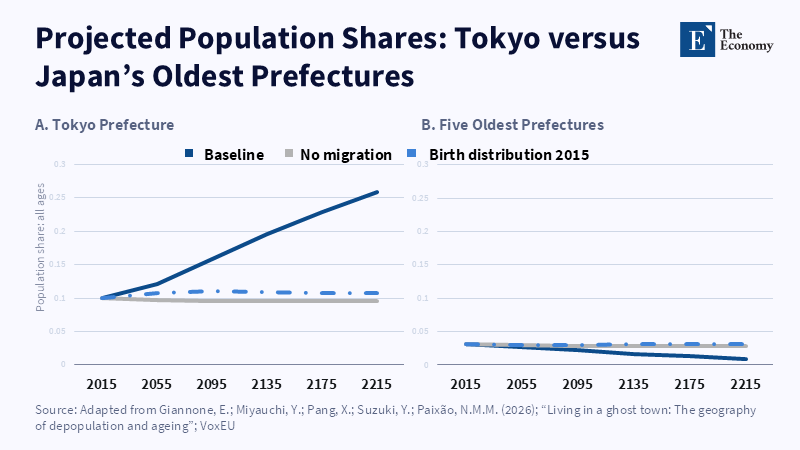
Figure 1: Tokyo’s projected rise and the oldest prefectures’ decline show that Japan’s demographic crisis is also a spatial planning problem. Related Articles:
Read More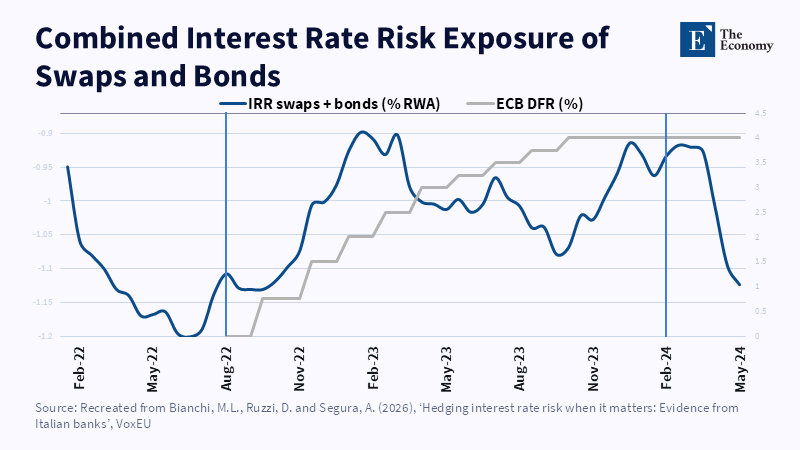
As the ECB tightening cycle advanced, combined swap-and-bond exposure became less negative, showing that hedging intensified when rate risk became visible. Related Articles:
Read More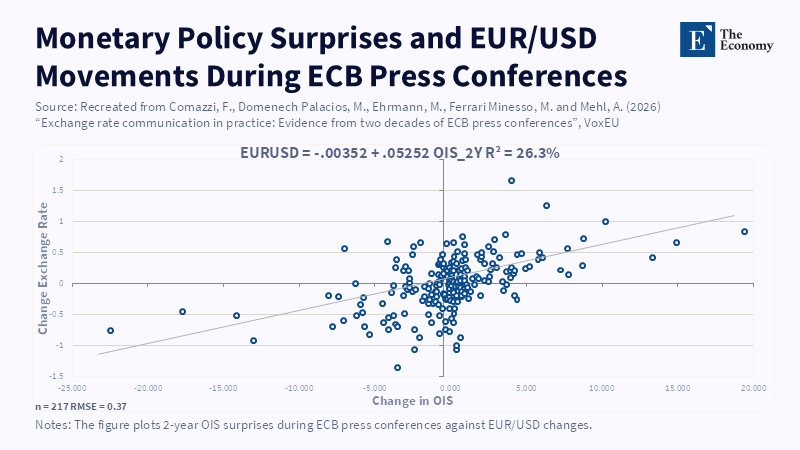
EUR/USD moves more clearly with monetary-policy surprises than with direct exchange-rate remarks. Related Articles: Exchange Rate Communication
Read More
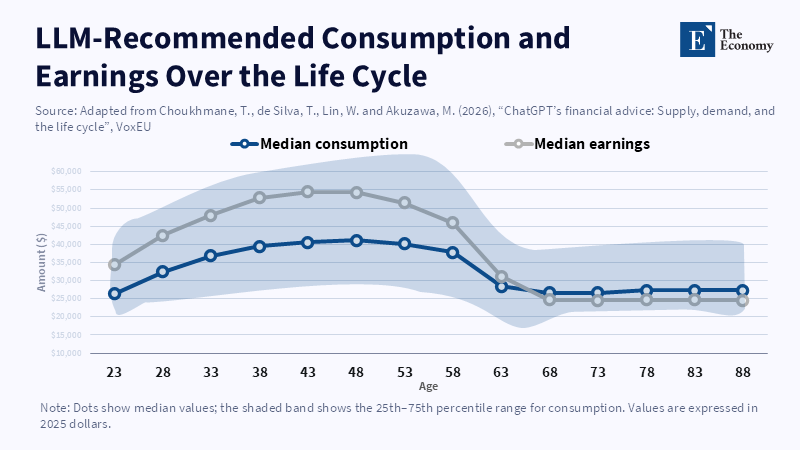
LLM advice smooths consumption across the life cycle, but the result depends on complete household information. Related Articles: Wh
Read More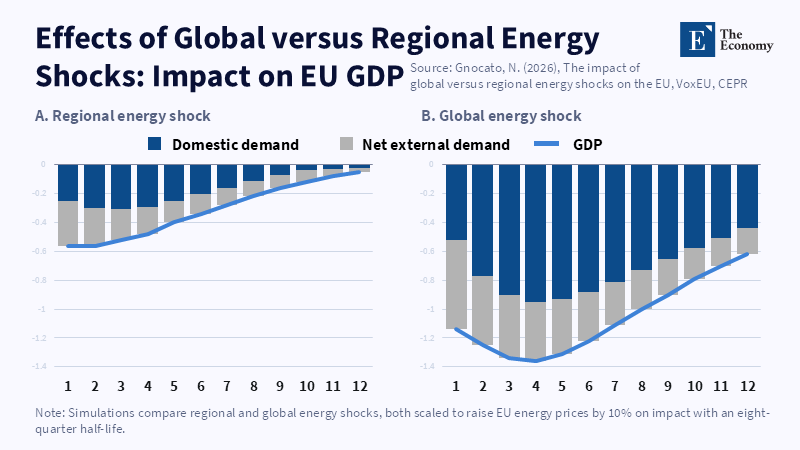
A global energy shock hits EU GDP harder because domestic demand and external demand weaken at the same time. Related Articles: The Global Energy Sho
Read More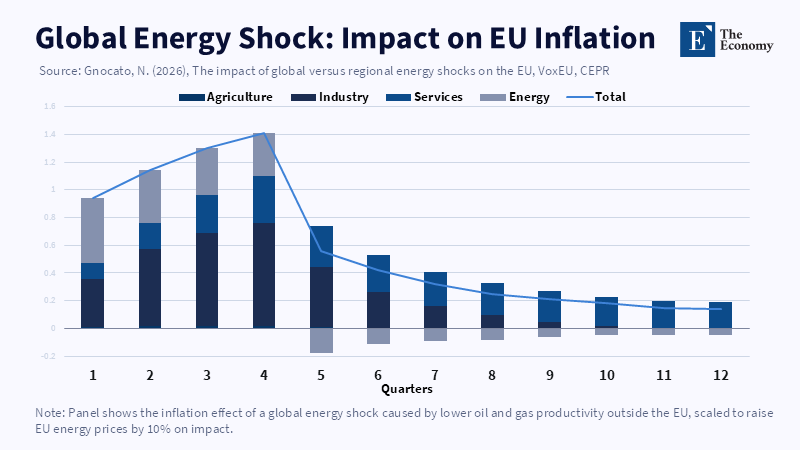
The global shock creates a much larger inflation peak because energy costs spread into industry, services, and traded goods. Related Articles: The G
Read More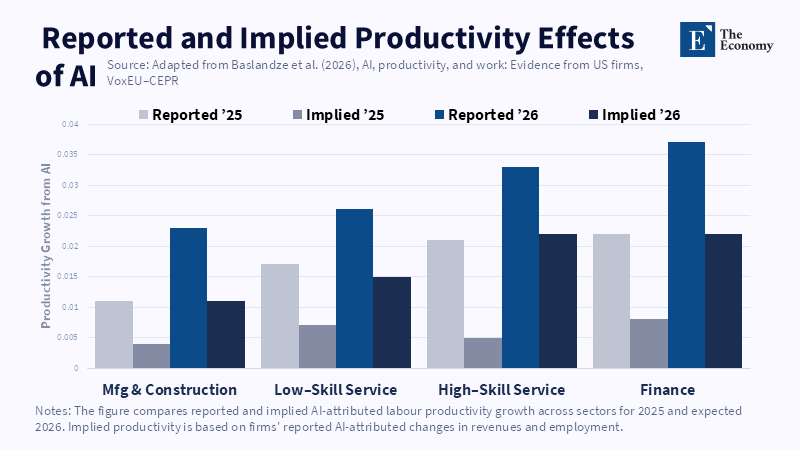
Reported gains exceed productivity growth implied by revenue and employment changes in every sector, with the largest expected effects in high-skill services and finance. Related Articles:
Read More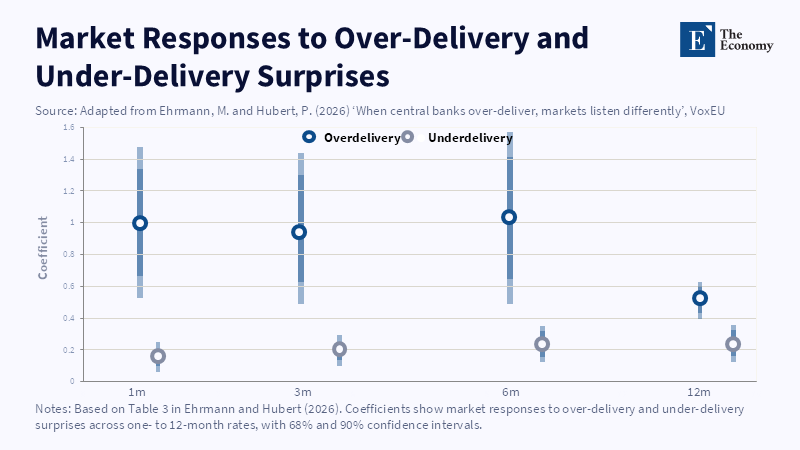
Over-delivery produces much larger short-rate responses, with the gap widest at the shortest maturities. Related Articles: Fed Communication Strat
Read More
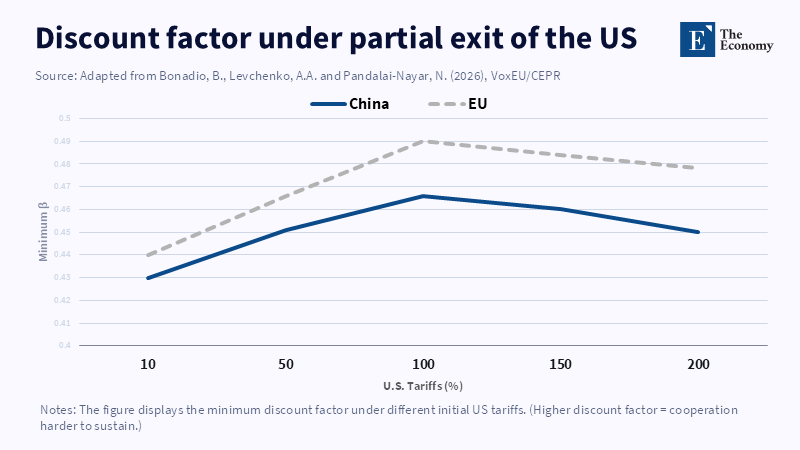
Higher US tariffs raise the cooperation threshold only modestly, suggesting that cooperation among the remaining economies can endure. Related Articles:
Read More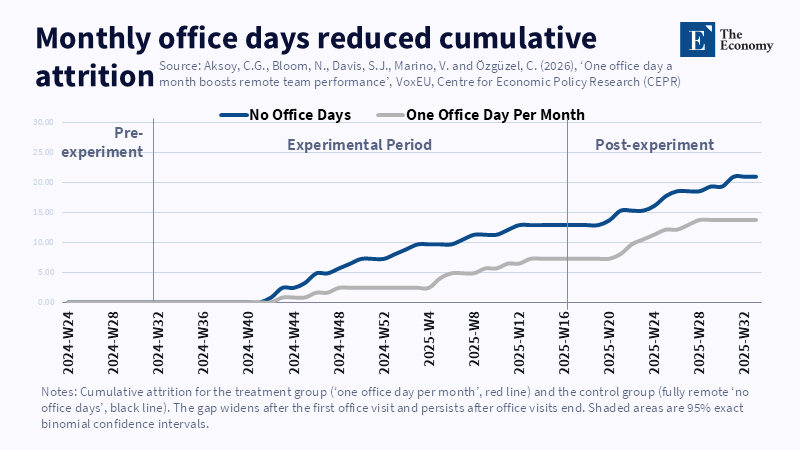
Monthly office contact was associated with lower cumulative attrition throughout the trial. Related Articles: Hybrid Work Productivity Depends on Des
Read More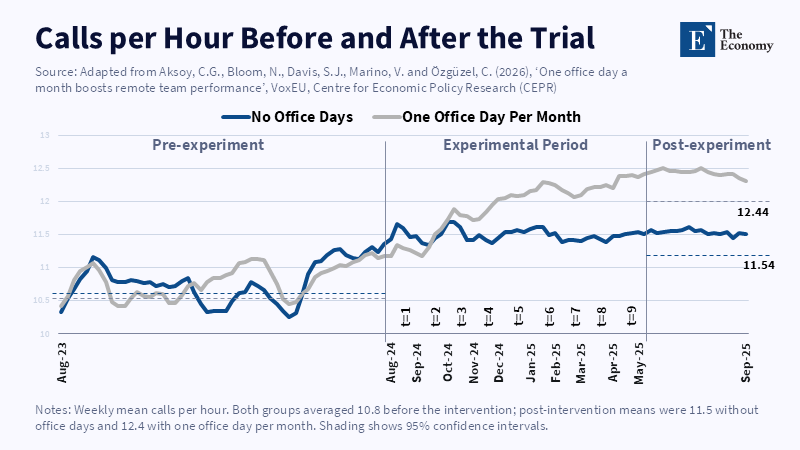
The productivity gap widened during the trial and remained after office visits ended. Related Articles: Hybrid Work Productivity Depends on Design, No
Read More
Chinese suppliers have gained substantial domestic market share, but shipment volume alone does not establish parity in usable frontier compute. Related Articles:
Read More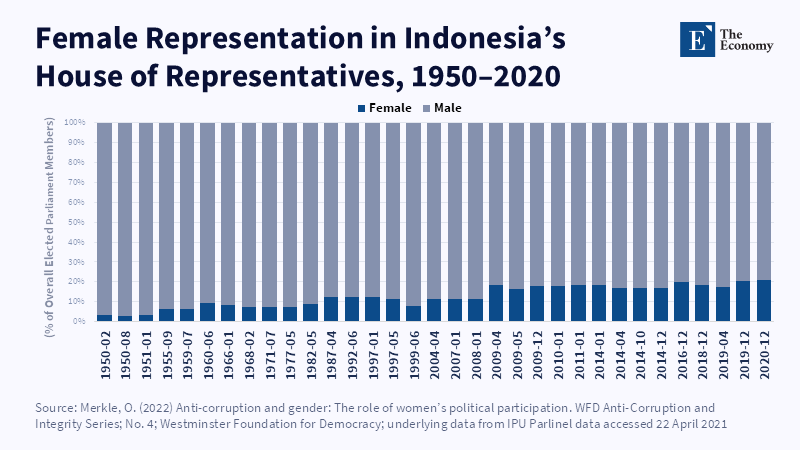
Indonesia’s gradual rise reflects wider political inclusion; it does not show that female representation alone produces cleaner government. Related Articles:
Read More