
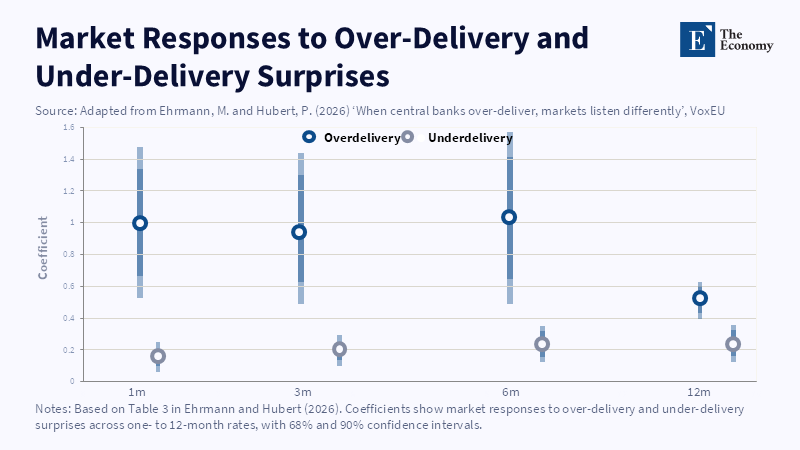
Over-delivery produces much larger short-rate responses, with the gap widest at the shortest maturities. Related Articles: Fed Communication Strat
Read More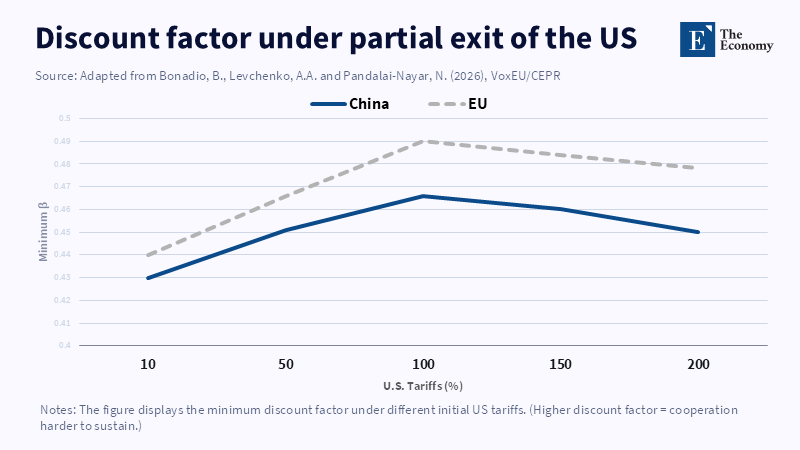
Higher US tariffs raise the cooperation threshold only modestly, suggesting that cooperation among the remaining economies can endure. Related Articles:
Read More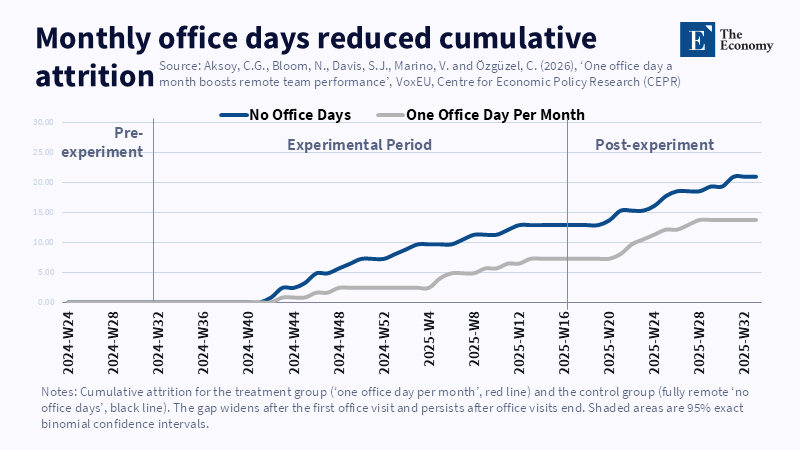
Monthly office contact was associated with lower cumulative attrition throughout the trial. Related Articles: Hybrid Work Productivity Depends on Des
Read More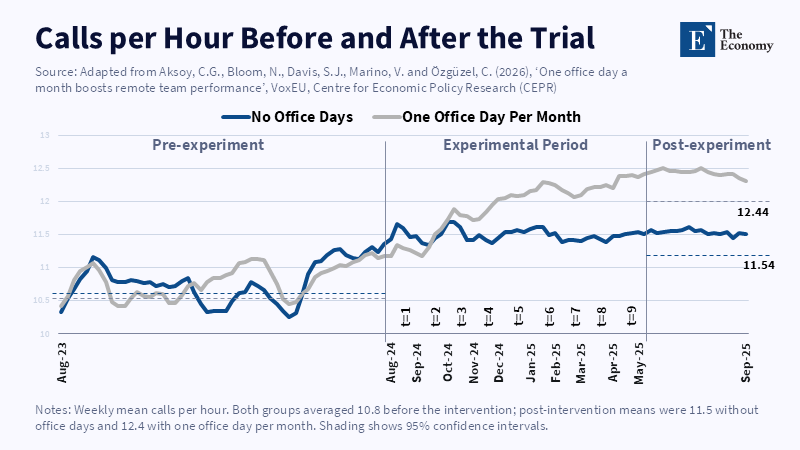
The productivity gap widened during the trial and remained after office visits ended. Related Articles: Hybrid Work Productivity Depends on Design, No
Read More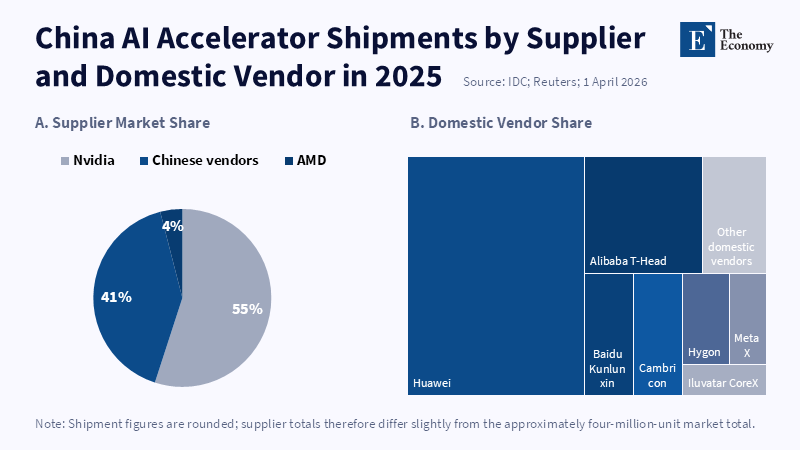
Chinese suppliers have gained substantial domestic market share, but shipment volume alone does not establish parity in usable frontier compute. Related Articles:
Read More


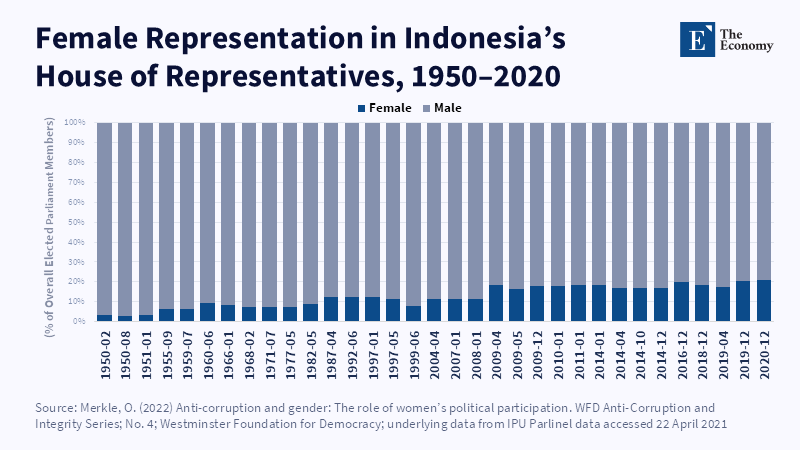
Indonesia’s gradual rise reflects wider political inclusion; it does not show that female representation alone produces cleaner government. Related Articles:
Read More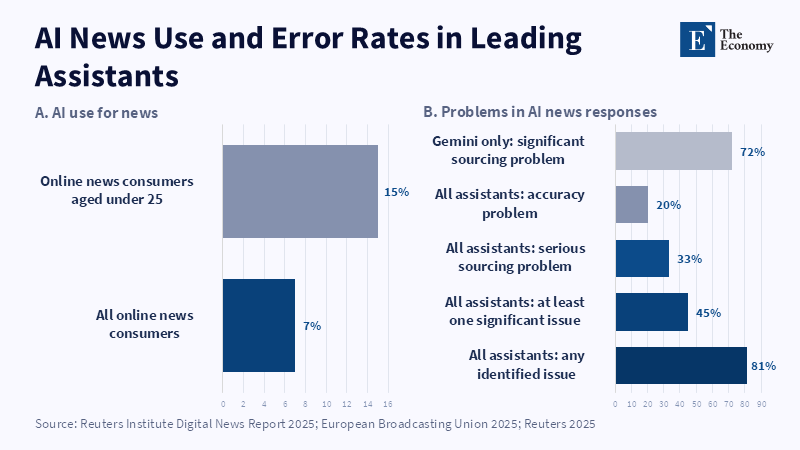
AI news use remains limited, but persistent sourcing and accuracy failures make verification an immediate policy concern. Related Articles:
Read More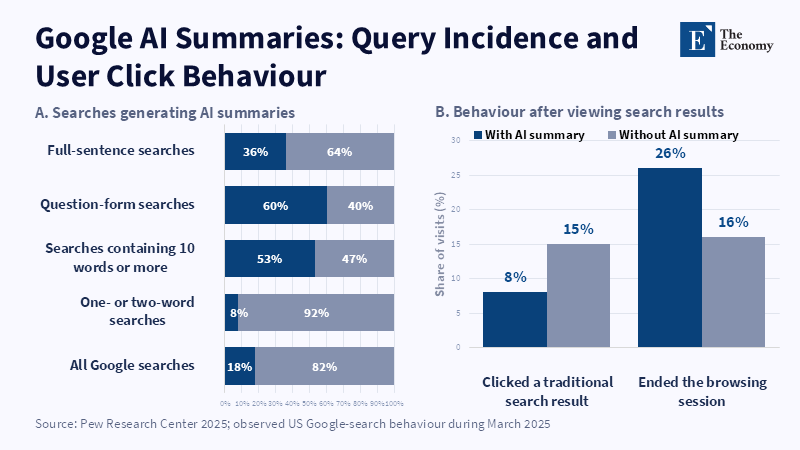
AI summaries increasingly turn search into a destination, reducing the traffic returned to original sources. Related Articles:
Read More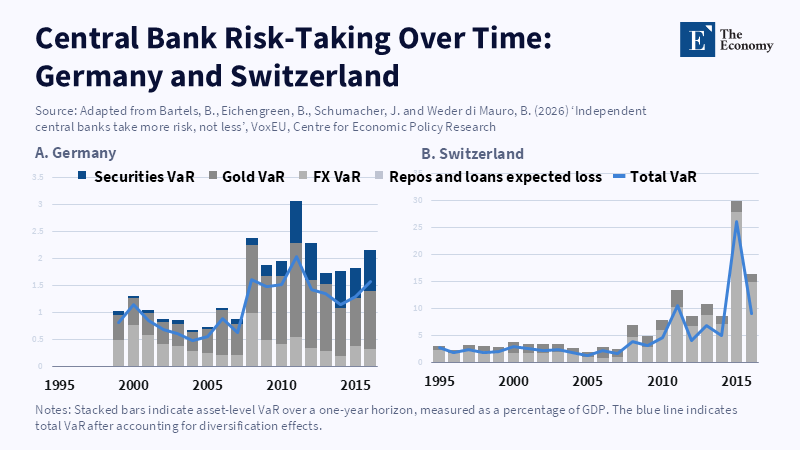
Germany and Switzerland show how central-bank risk can rise through different asset mixes, with foreign-exchange exposure driving Switzerland’s largest swings. Related Articles:
Read More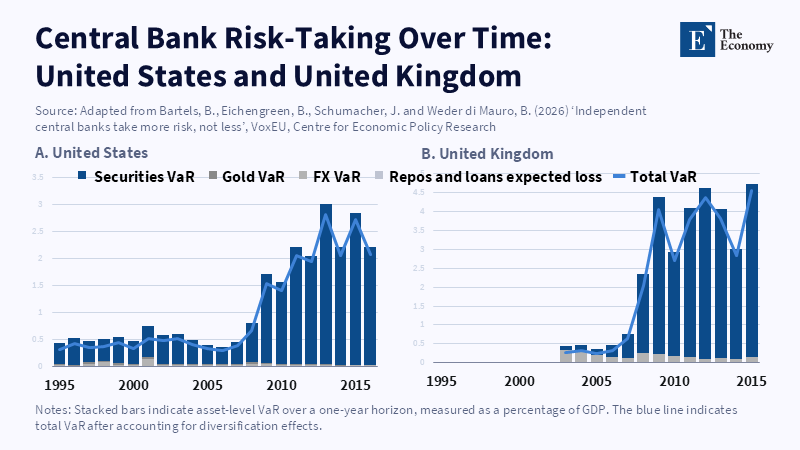
Balance-sheet risk rose sharply as conventional rate policy reached its limits, driven mainly by larger securities holdings. Related Articles: Fed
Read More
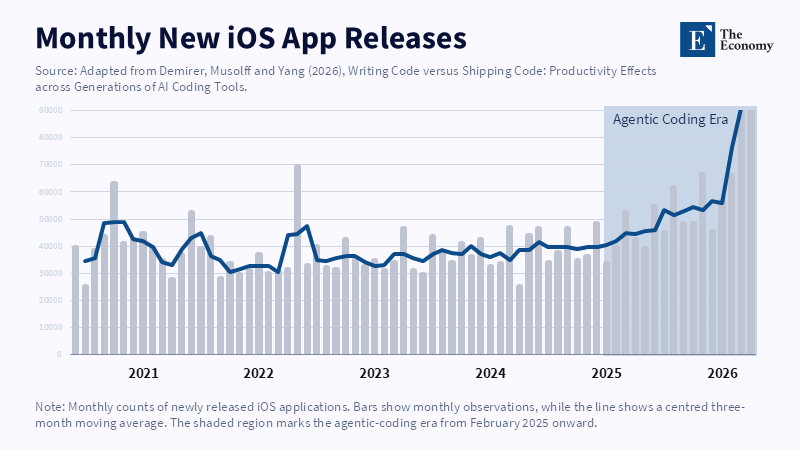
Agentic coding increased the supply of new apps, but release volume alone does not measure economic value.
Read More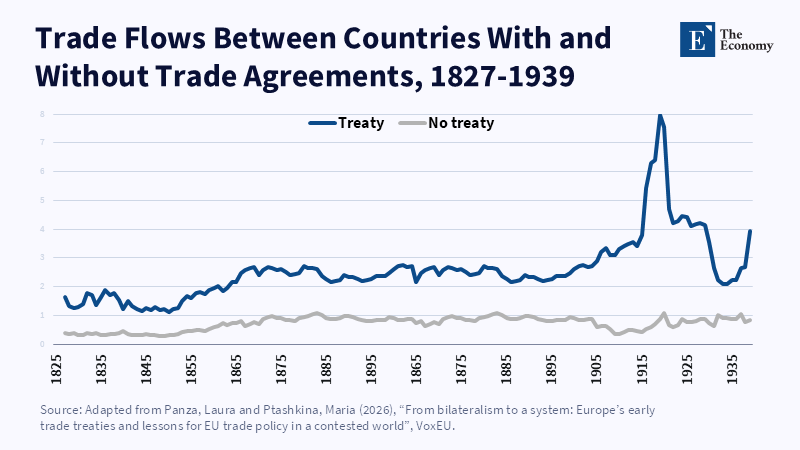
Treaty partners exported far more on average, though the raw gap is descriptive rather than a causal estimate. Related Articles: Middle-Power Trade
Read More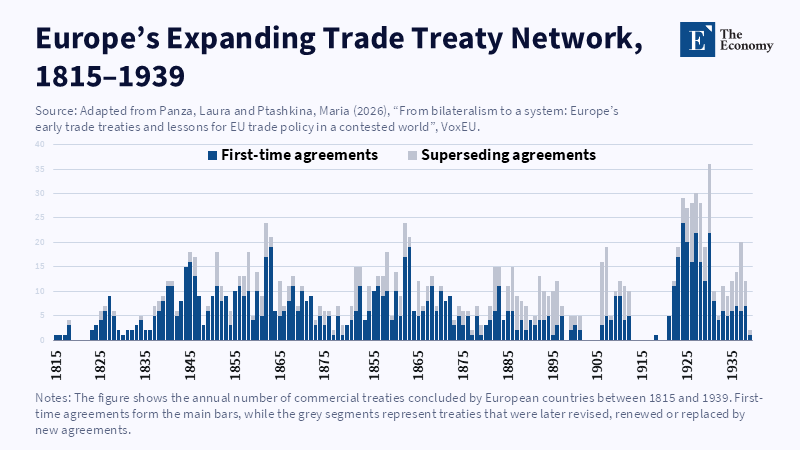
Europe’s trade order grew through repeated waves of new and renewed agreements, not through a single grand bargain. Related Articles: Middle-Powe
Read More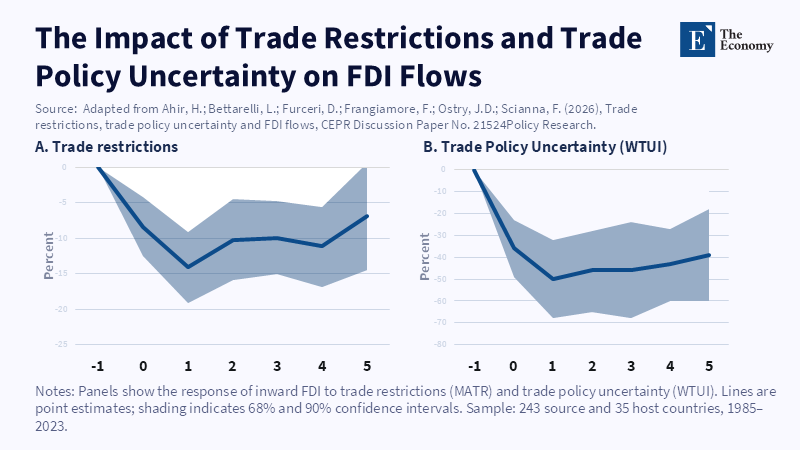
Uncertainty produces a sharp and persistent investment loss, with the largest decline occurring one year after the shock. Related Articles: Trade Poli
Read More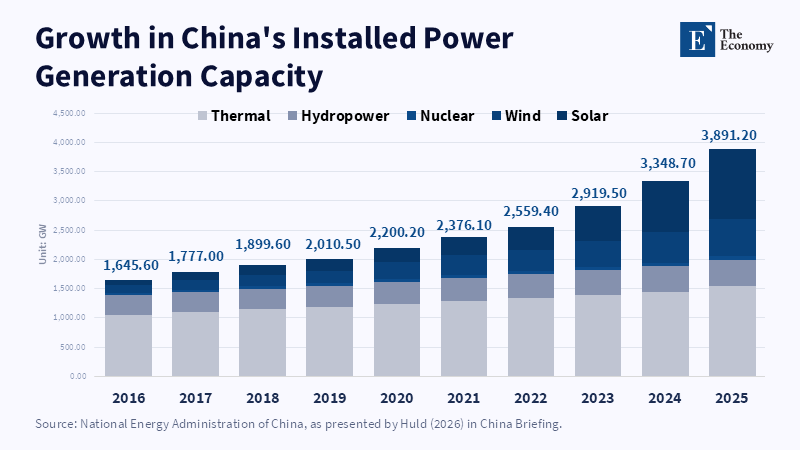
China’s capacity expansion shows that its green-energy advantage rests on an integrated power system, not one isolated technology. Related Articles:
Read More
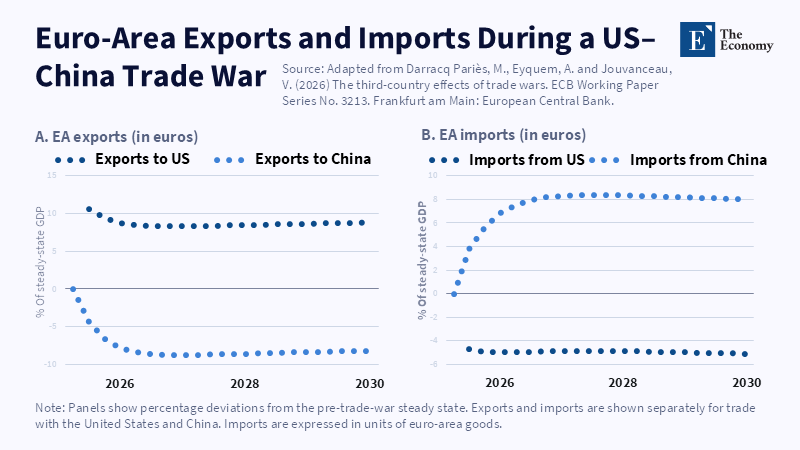
Europe gains access to diverted trade, but the direction and scale of the effect differ sharply between the US and Chinese markets.
Read More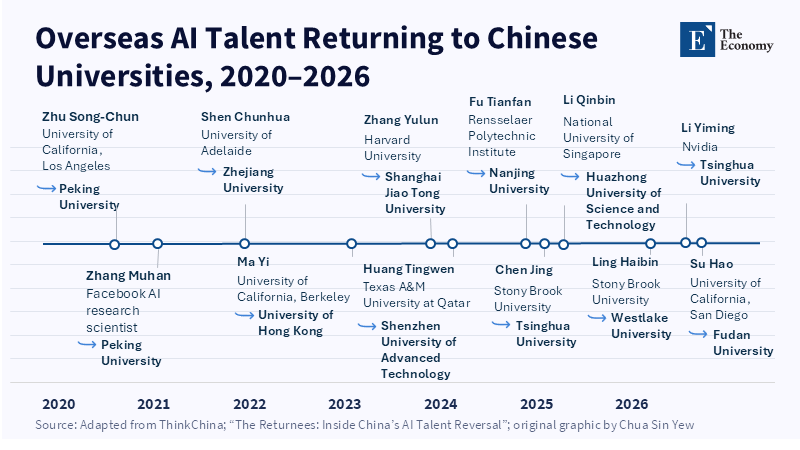
High-profile returnees show how China is converting overseas experience into domestic university research capacity. Related Articles: AI Talent Retention
Read More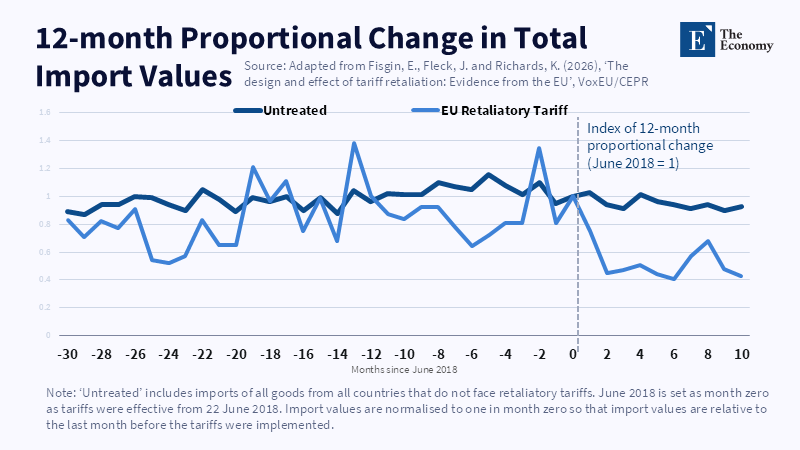
Retaliation redirected trade and the shift endured.
Read More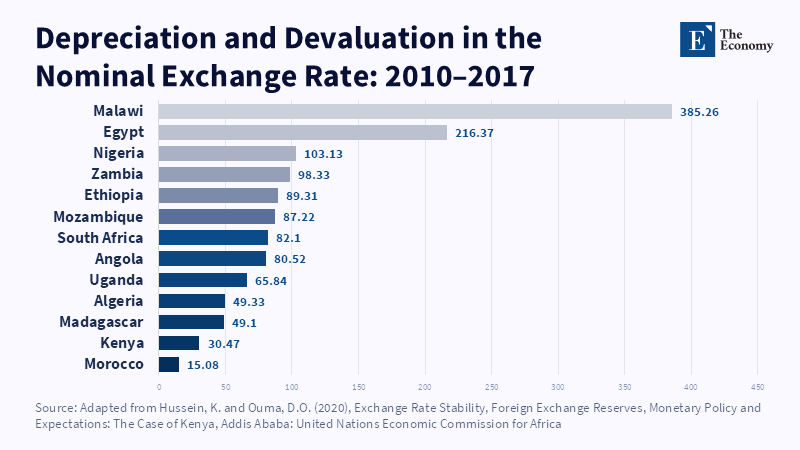
Kenya’s lower depreciation relative to many peers shows that reserve size alone does not determine currency stability. Related Articles: Foreign Exch
Read More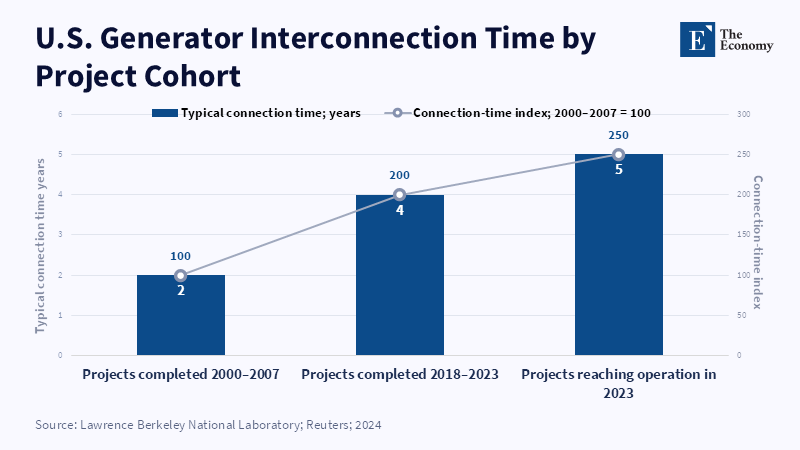
Grid connection times have stretched to five years, turning time-to-power into a decisive constraint on AI investment. Related Articles: The AI Race Ne
Read More