Financial
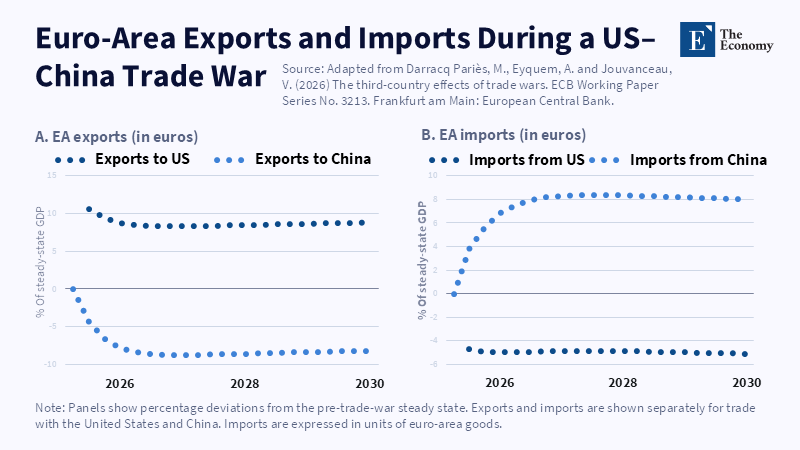
Europe gains access to diverted trade, but the direction and scale of the effect differ sharply between the US and Chinese markets.
Read More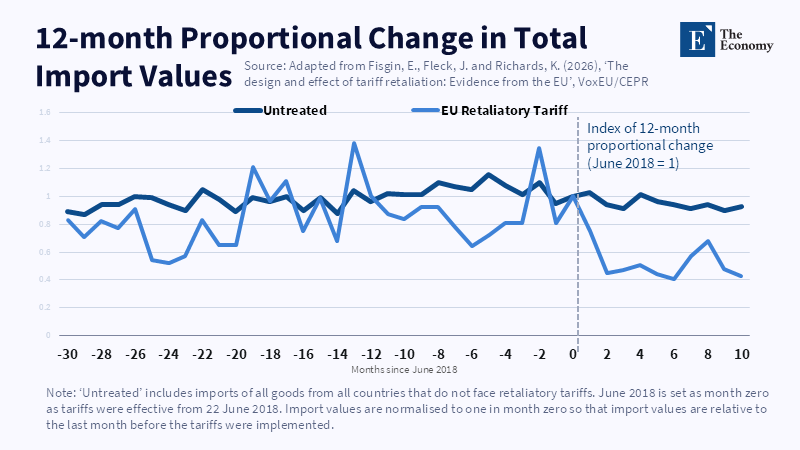
Retaliation redirected trade and the shift endured.
Read More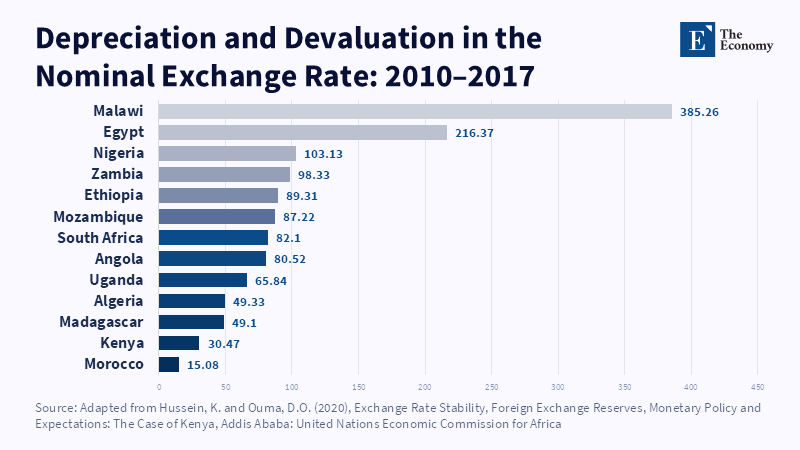
Kenya’s lower depreciation relative to many peers shows that reserve size alone does not determine currency stability. Related Articles: Foreign Exch
Read More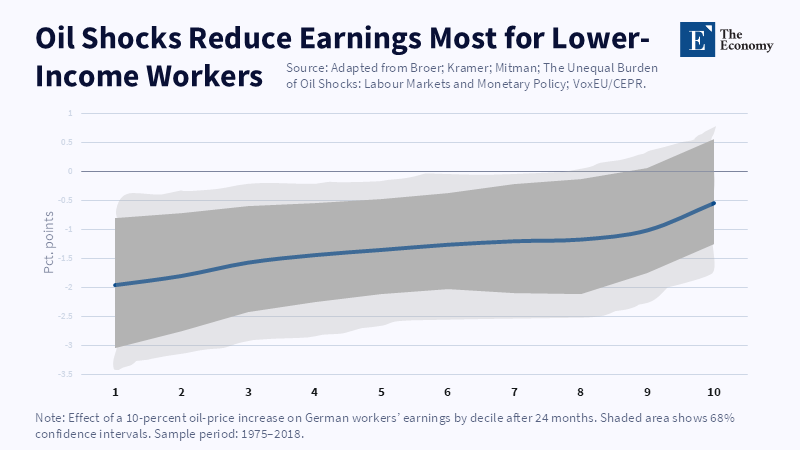
Lower-income workers suffer the clearest earnings loss two years after a 10% oil-price increase, showing why oil shocks quickly become inequality shocks.
Read More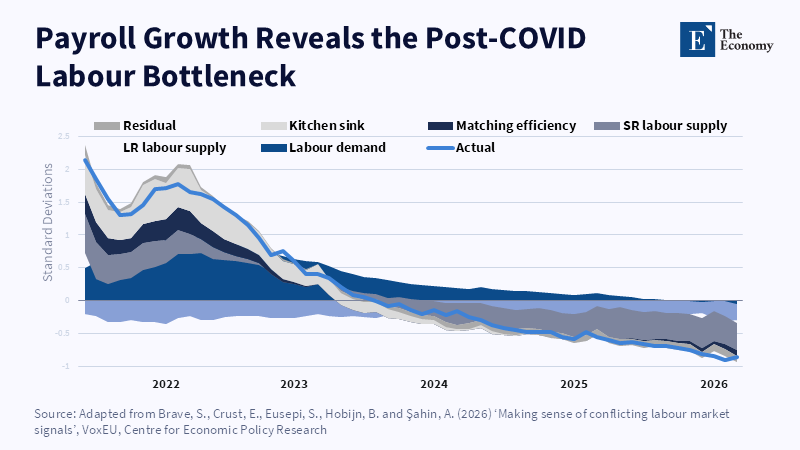
Payroll growth shows that the recovery was constrained not only by demand, but also by labour supply, matching and missing work capacity. Related Articles:
Read More







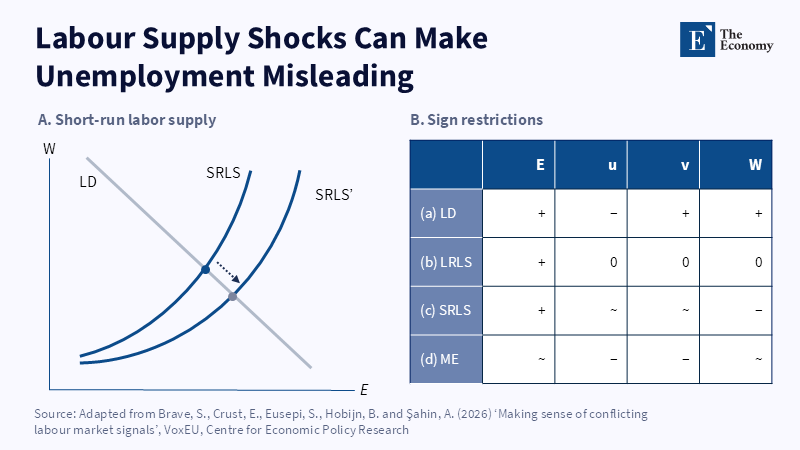
A supply shock can change employment and wages while leaving unemployment too calm to reveal the real bottleneck. Related Articles: The Unemployment Rate
Read More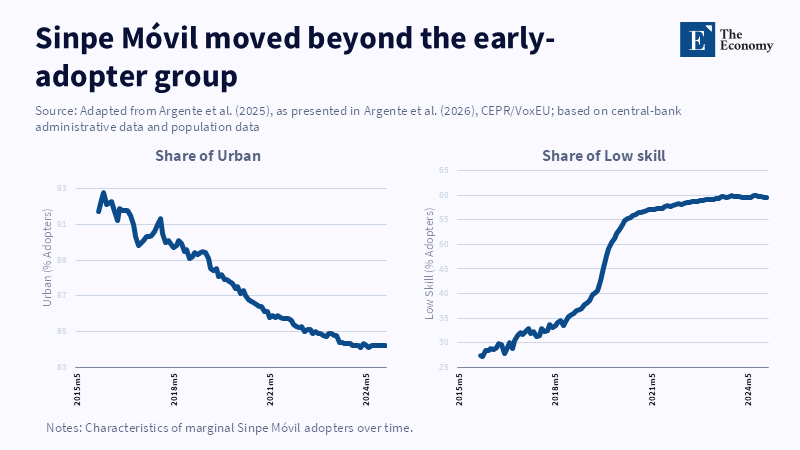
As Sinpe Móvil scaled, new adopters became less urban and more likely to be lower-skill workers, showing that inclusive payment systems spread beyond the early-adopter group. Related Articles:
Read More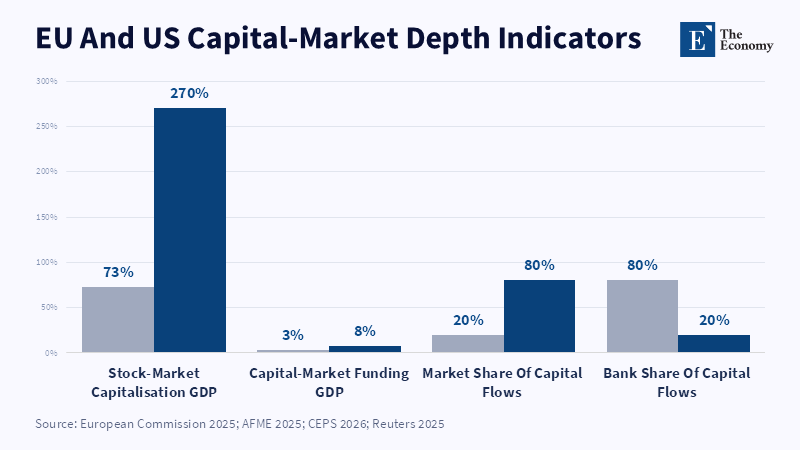
Europe’s capital-market deficit is not one gap, but a system-wide weakness across equity depth, market funding and bank dependence. Related Articles: Europe’s Savings Paradox: Why Abundance
Read More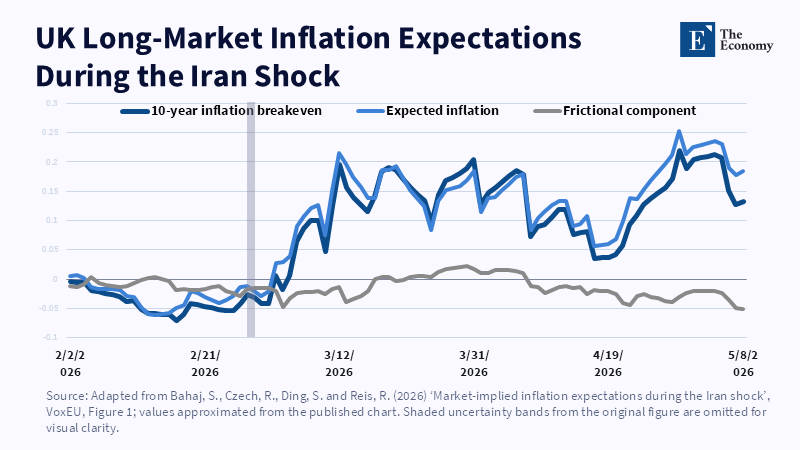
The UK long-market signal rose during the Iran shock, while the frictional component stayed much flatter, showing why raw bond-market inflation signals should be filtered before being treated as true expectations.
Read More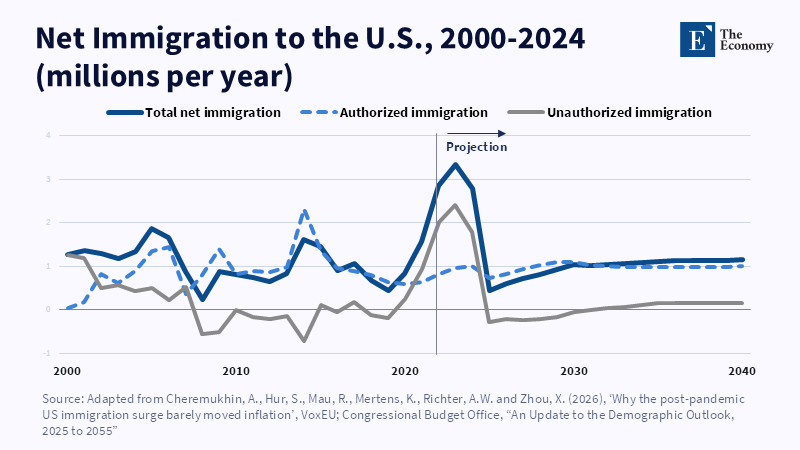
The immigration surge was large, but projections show it was not a permanent doubling of consumer demand.
Read More
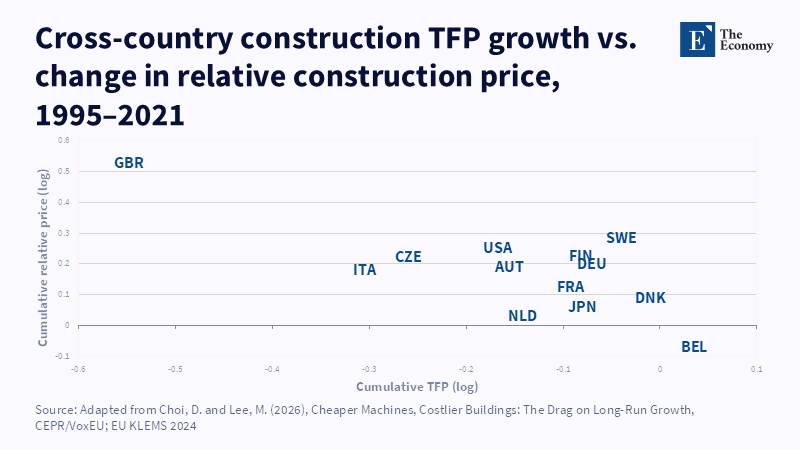
Across advanced economies, weaker construction TFP growth is associated with higher relative construction prices.
Read More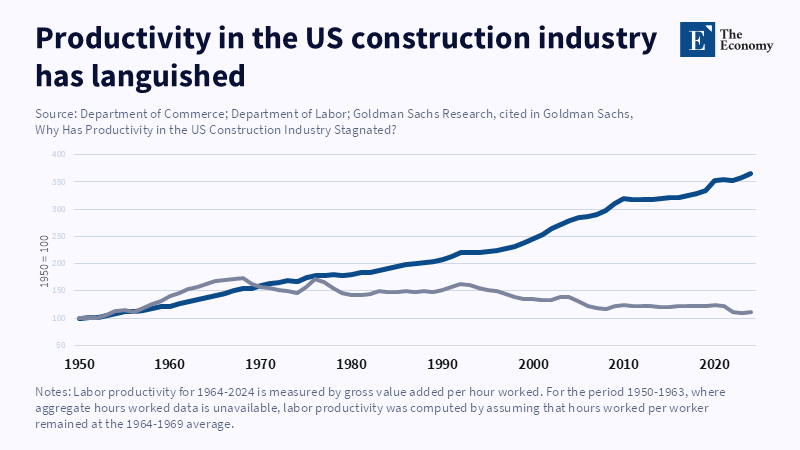
U.S. economy-wide labor productivity has risen sharply since 1950, while construction labor productivity has barely improved.
Read More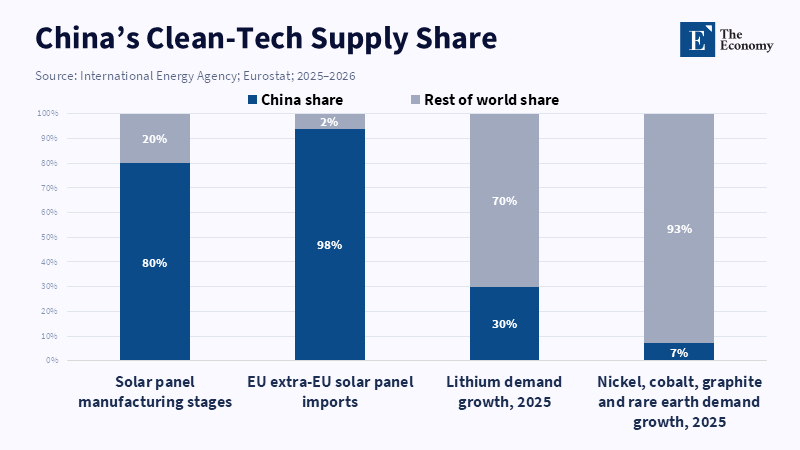
China’s clean-tech dominance shows why cheaper supply can become a strategic dependency problem for Europe. Related Articles: China’s Subsidy Mo
Read More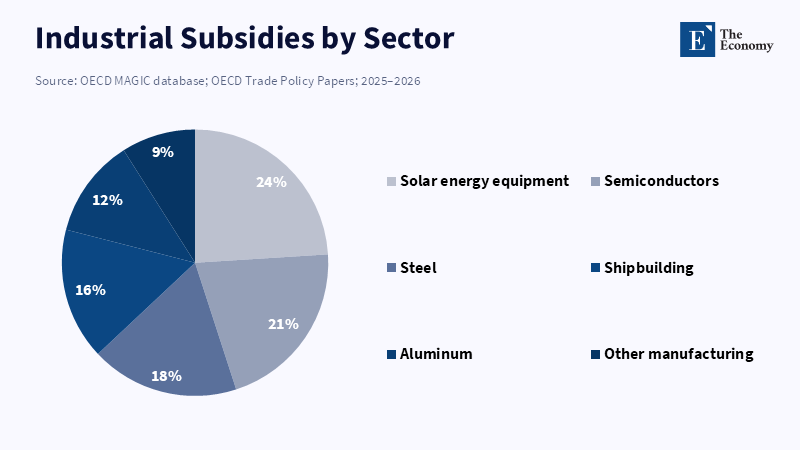
Subsidies are concentrated in sectors that now shape the next phase of industrial competition: solar, chips, steel, aluminium and shipbuilding. Related Articles:
Read More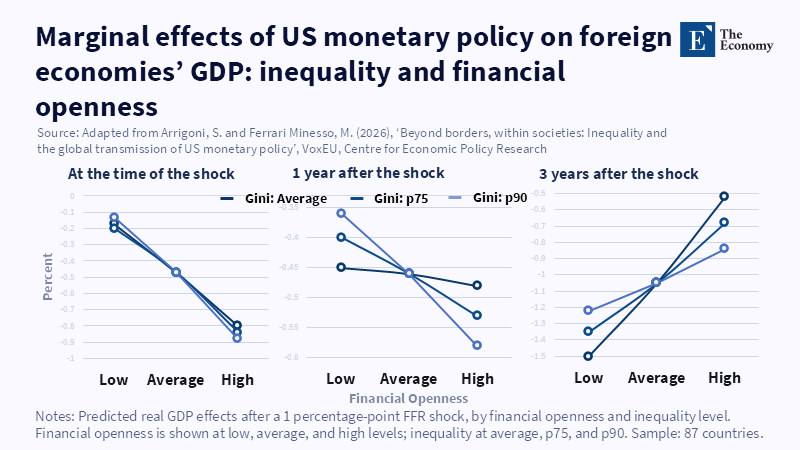
Financial openness changes the transmission channel: the same US shock can ease or deepen the GDP effect depending on inequality and market exposure. Related Articles:
Read More
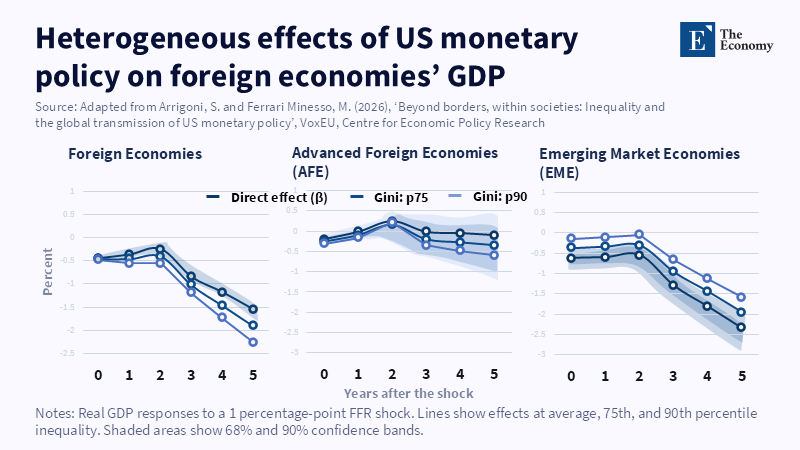
One US rate shock produces very different GDP losses across foreign economies, with emerging markets showing the sharpest delayed decline. Related Articles:
Read More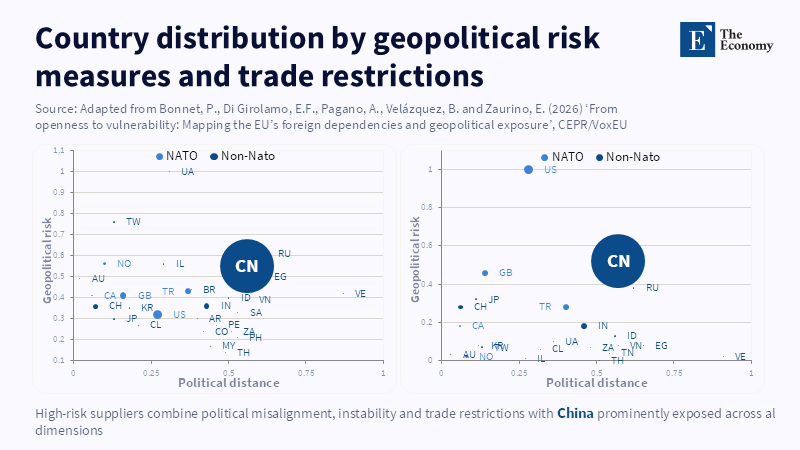
Dependency becomes strategic risk when product concentration overlaps with political distance, instability and trade restrictions.
Read More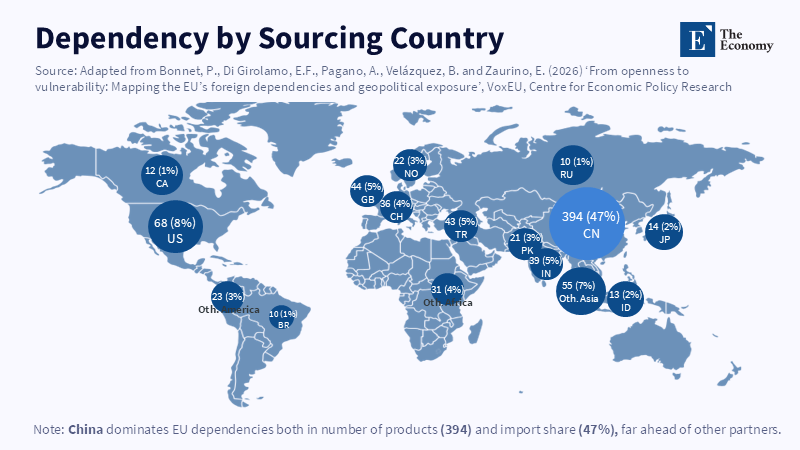
China is not one supplier among many.
Read More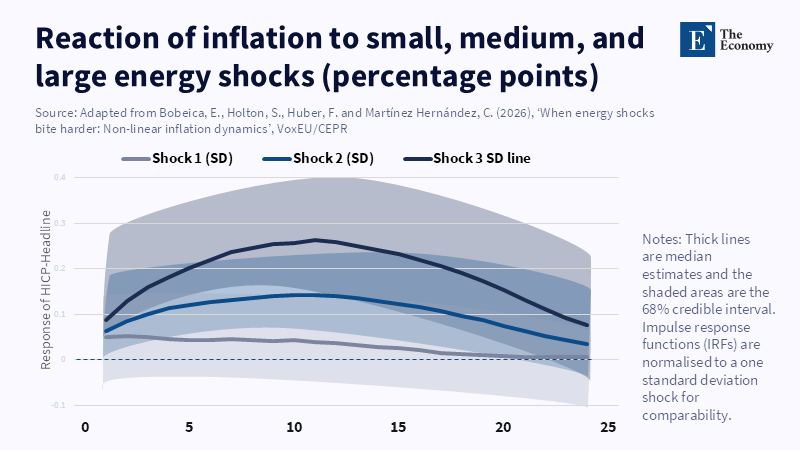
Large energy shocks do not simply produce larger effects; they bend the inflation response upward and make pass-through more persistent.
Read More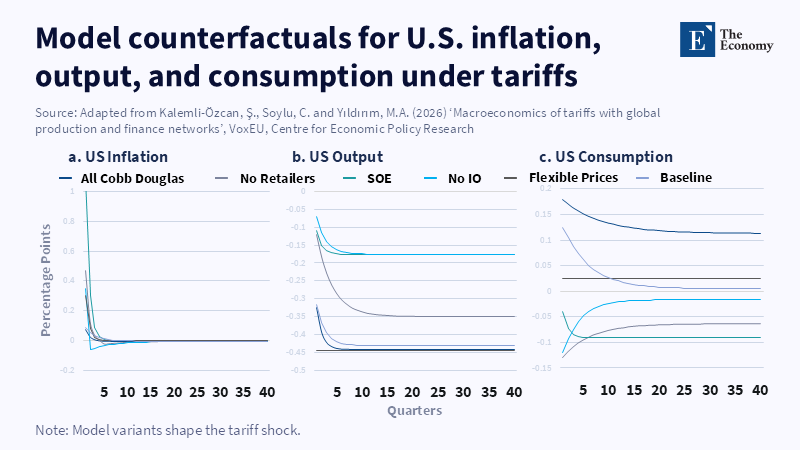
Tariffs become stagflationary when the shock passes through production networks, prices, output, and consumption at once.
Read More