Financial
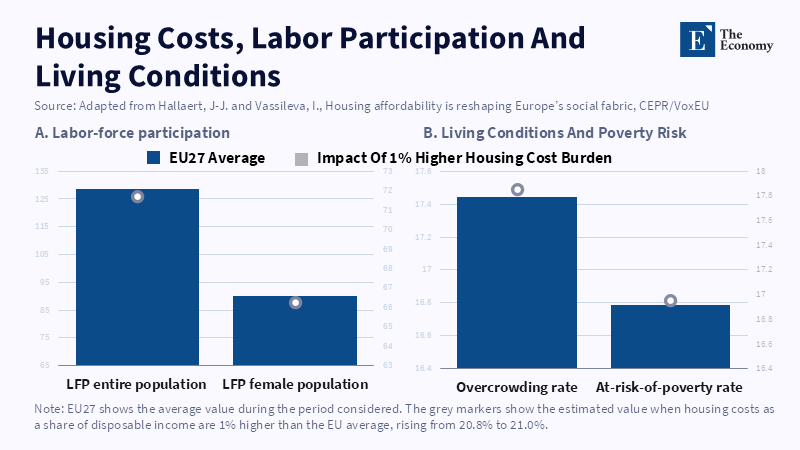
Figure 1: Even a small rise in the housing-cost burden is linked to lower labour-force participation and worse living conditions, reinforcing housing as a labour-market constraint. Related article:
Read More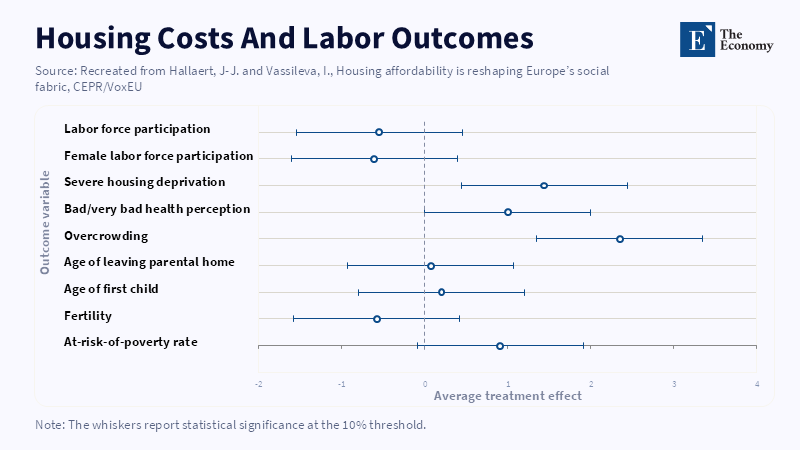
Figure 1: Higher housing costs are associated with weaker labour participation and wider social strain, especially overcrowding, housing deprivation, poverty risk and health pressure. Related articl
Read More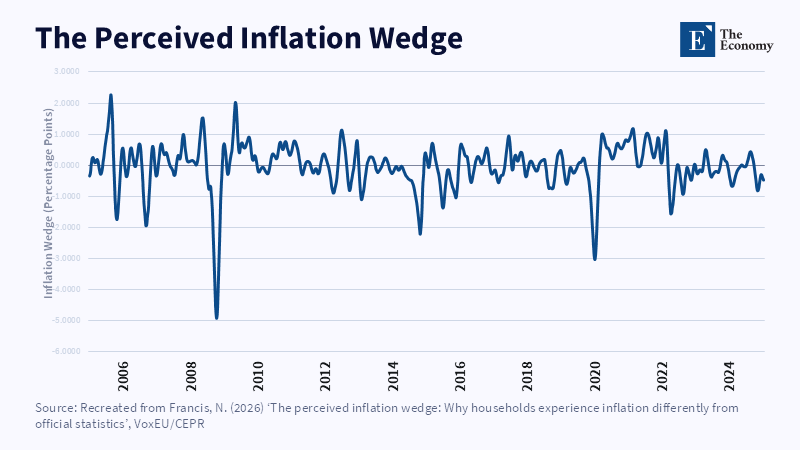
Figure 2:The wedge widens when household price perceptions diverge from official inflation. Related article: Perceived Inflation Is the New Test of Price
Read More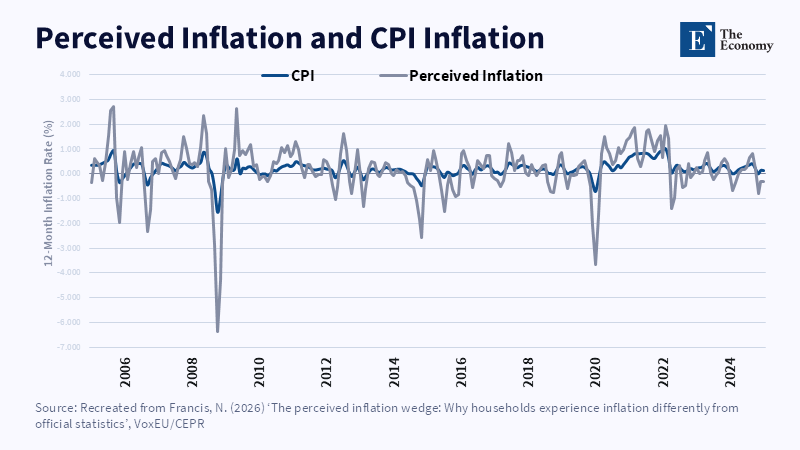
Figure 1: Perceived inflation broadly tracks CPI but reacts more sharply during major price shocks. Related article: Perceived Inflation Is the New Test of
Read More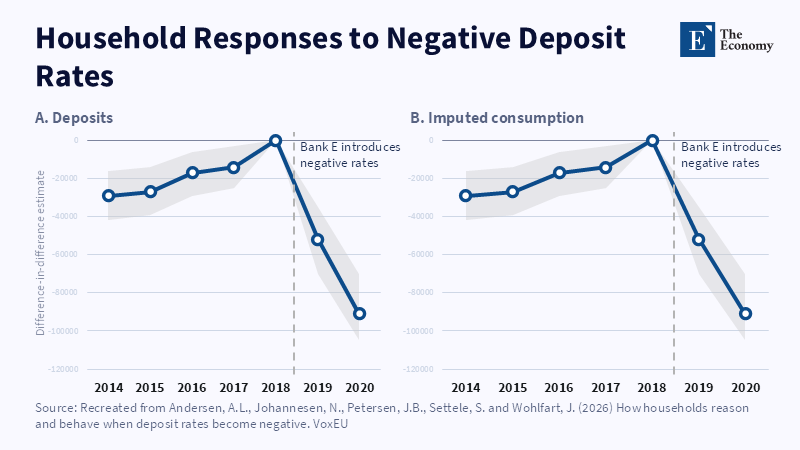
Figure 1: Danish households exposed to negative deposit rates cut deposits sharply while estimated consumption rose after exposure. Related article:
Read More







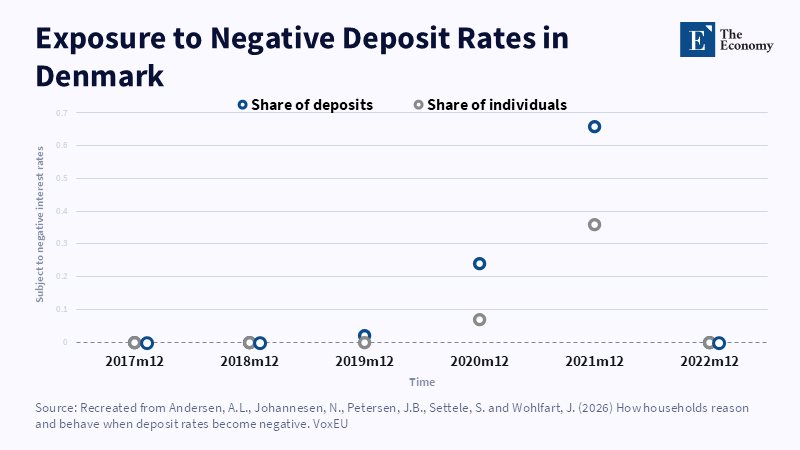
Figure 1: Negative rates spread quickly across Denmark, reaching about one-third of individuals and two-thirds of deposits by late 2021. Related article:
Read More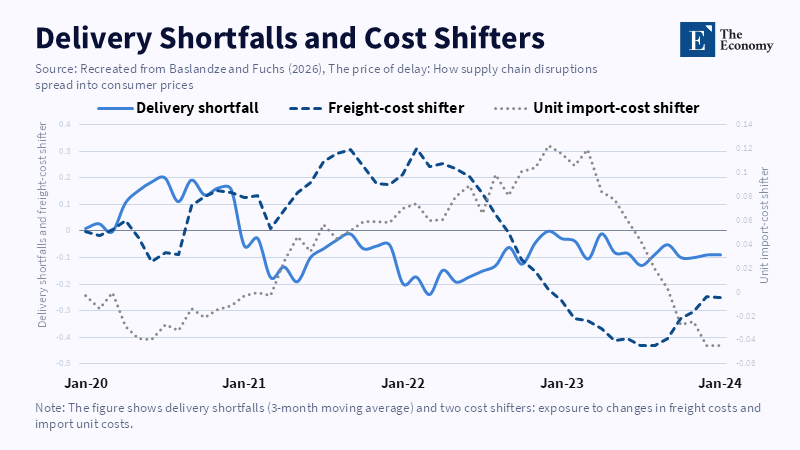
Figure 2: Delivery shortfalls moved with freight and import-cost pressures, showing how scarcity and costs reinforced each other. Related article: Su
Read More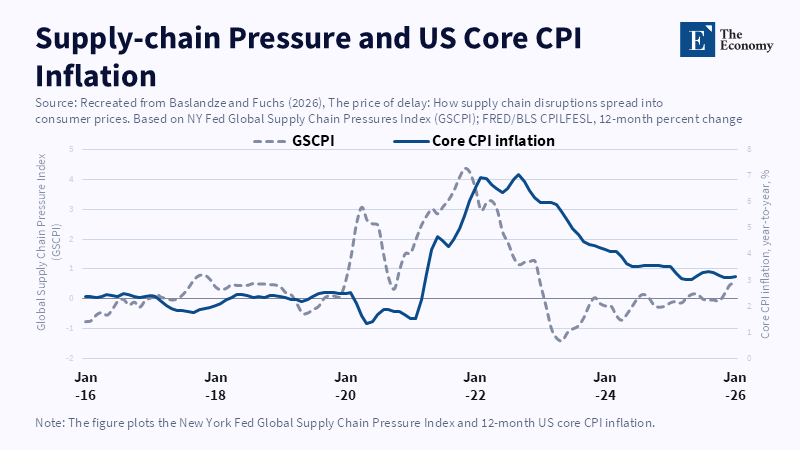
Figure 1: Supply-chain pressure surged before core inflation peaked, showing why logistics shocks can become delayed price pressure. Related article: Su
Read More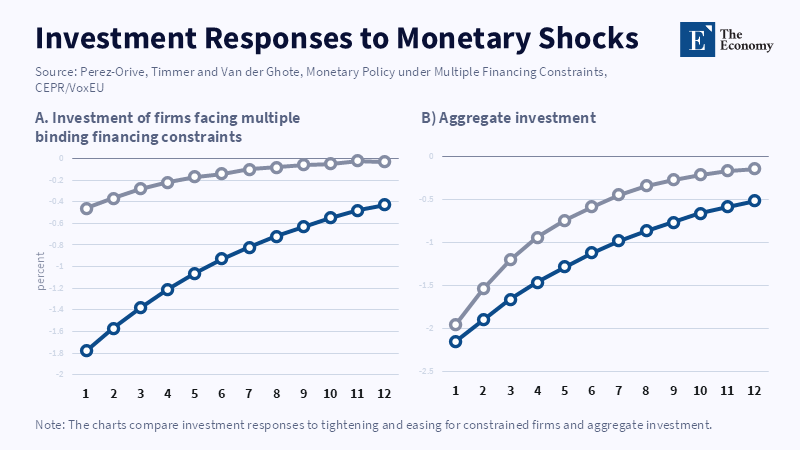
Figure 2: The model shows tightening causes a deeper investment fall than equal easing can reverse. Related articles: Asymmetric Monetary Policy an
Read More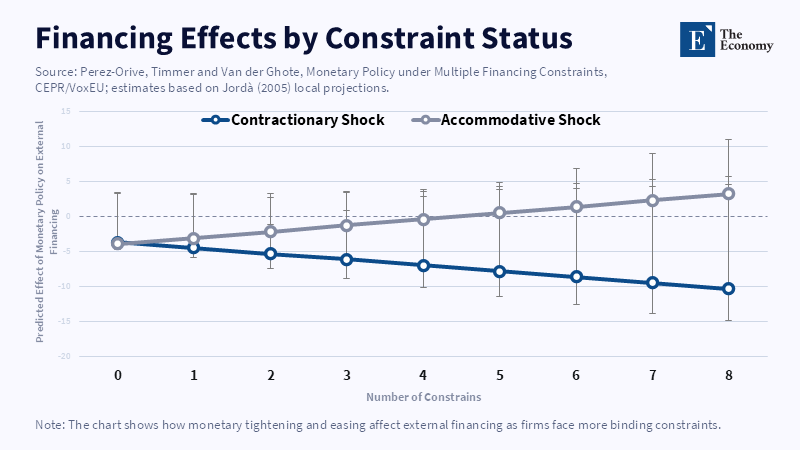
Figure 1: Tightening cuts external financing more sharply as firms face more binding constraints. Related article: Asymmetric Monetary Policy and th
Read More
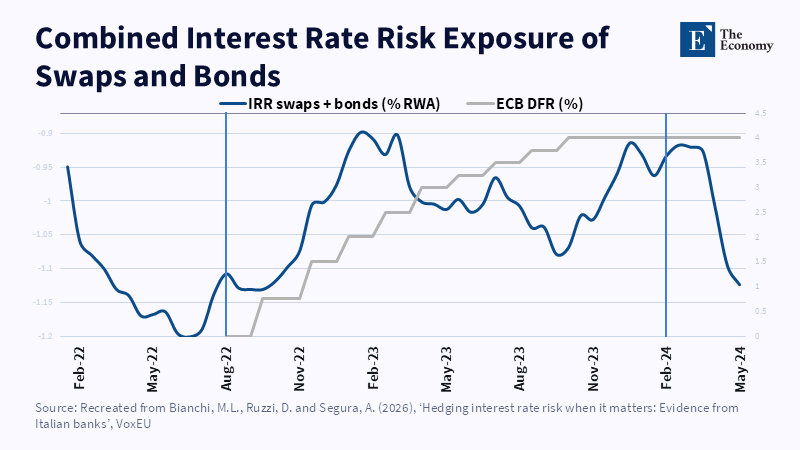
As the ECB tightening cycle advanced, combined swap-and-bond exposure became less negative, showing that hedging intensified when rate risk became visible. Related Articles:
Read More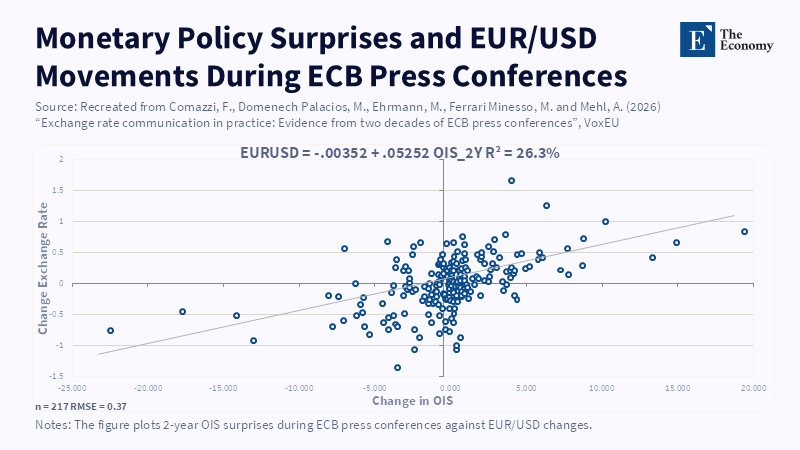
EUR/USD moves more clearly with monetary-policy surprises than with direct exchange-rate remarks. Related Articles: Exchange Rate Communication
Read More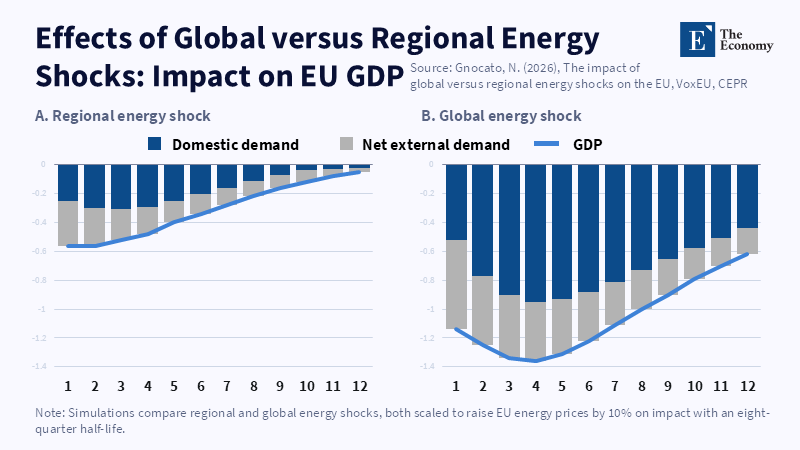
A global energy shock hits EU GDP harder because domestic demand and external demand weaken at the same time. Related Articles: The Global Energy Sho
Read More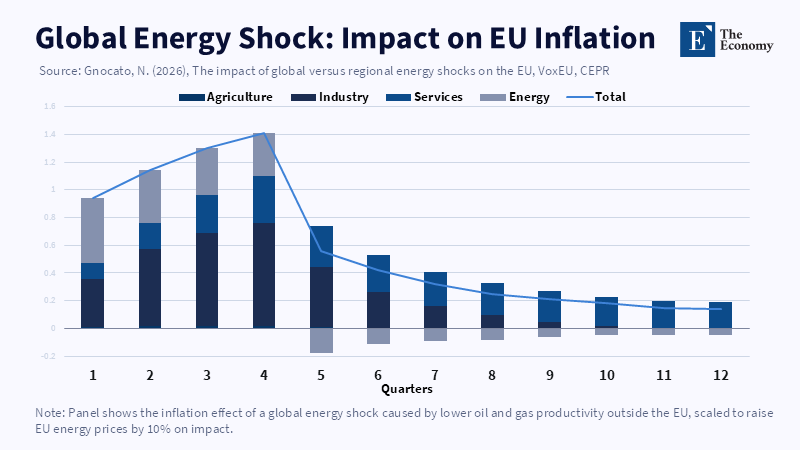
The global shock creates a much larger inflation peak because energy costs spread into industry, services, and traded goods. Related Articles: The G
Read More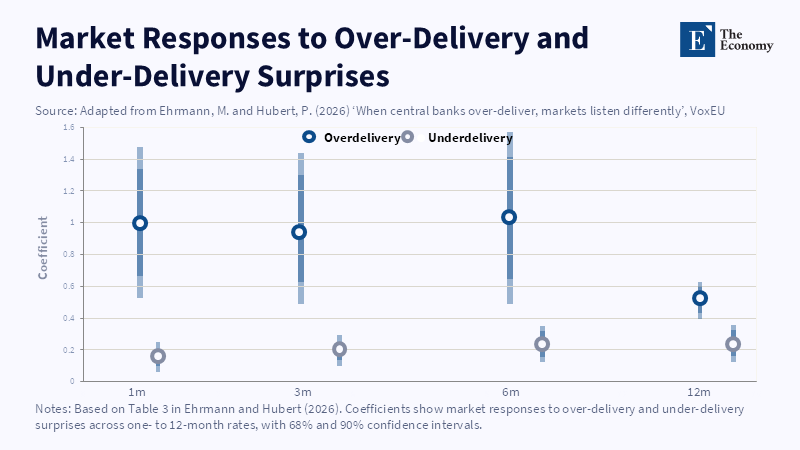
Over-delivery produces much larger short-rate responses, with the gap widest at the shortest maturities. Related Articles: Fed Communication Strat
Read More
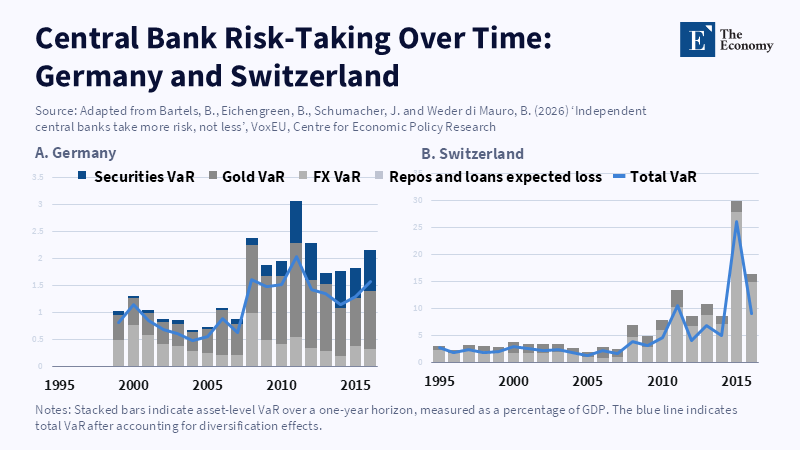
Germany and Switzerland show how central-bank risk can rise through different asset mixes, with foreign-exchange exposure driving Switzerland’s largest swings. Related Articles:
Read More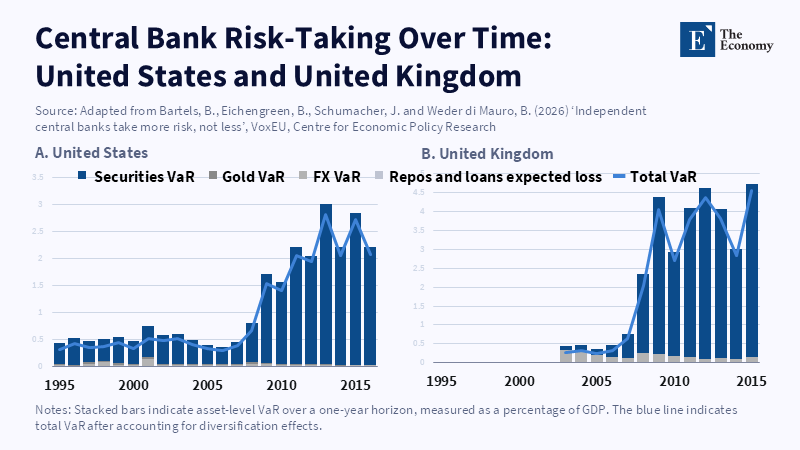
Balance-sheet risk rose sharply as conventional rate policy reached its limits, driven mainly by larger securities holdings. Related Articles: Fed
Read More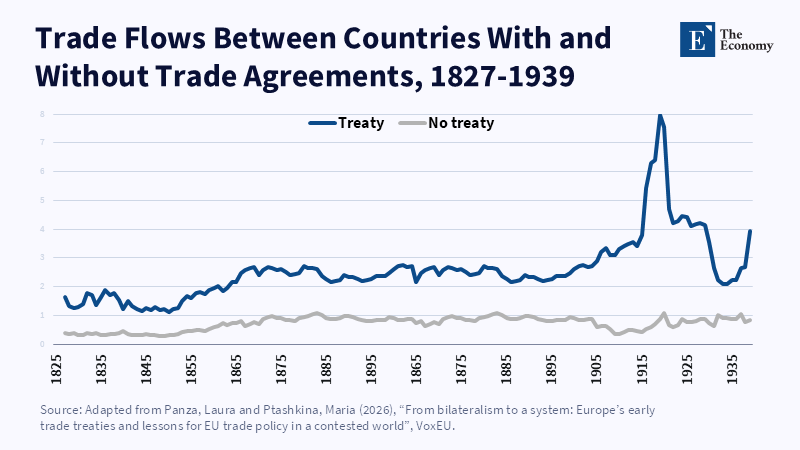
Treaty partners exported far more on average, though the raw gap is descriptive rather than a causal estimate. Related Articles: Middle-Power Trade
Read More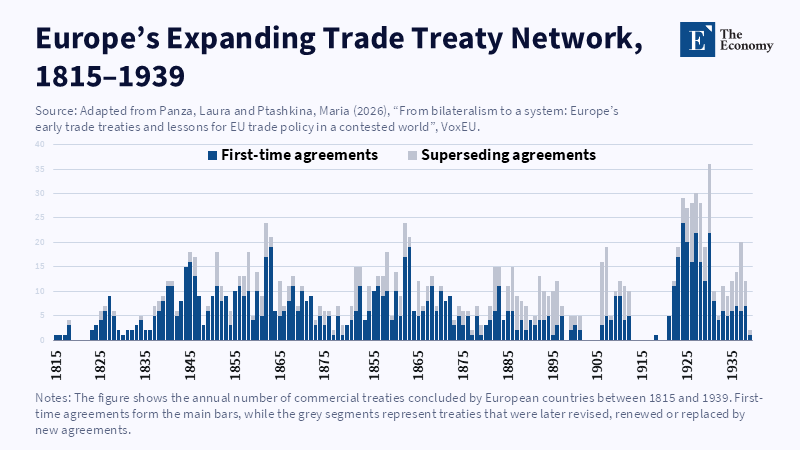
Europe’s trade order grew through repeated waves of new and renewed agreements, not through a single grand bargain. Related Articles: Middle-Powe
Read More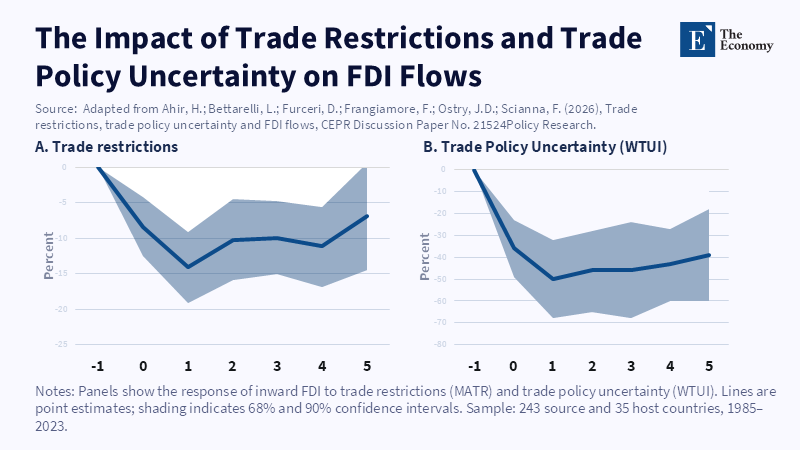
Uncertainty produces a sharp and persistent investment loss, with the largest decline occurring one year after the shock. Related Articles: Trade Poli
Read More